Fig. 2.
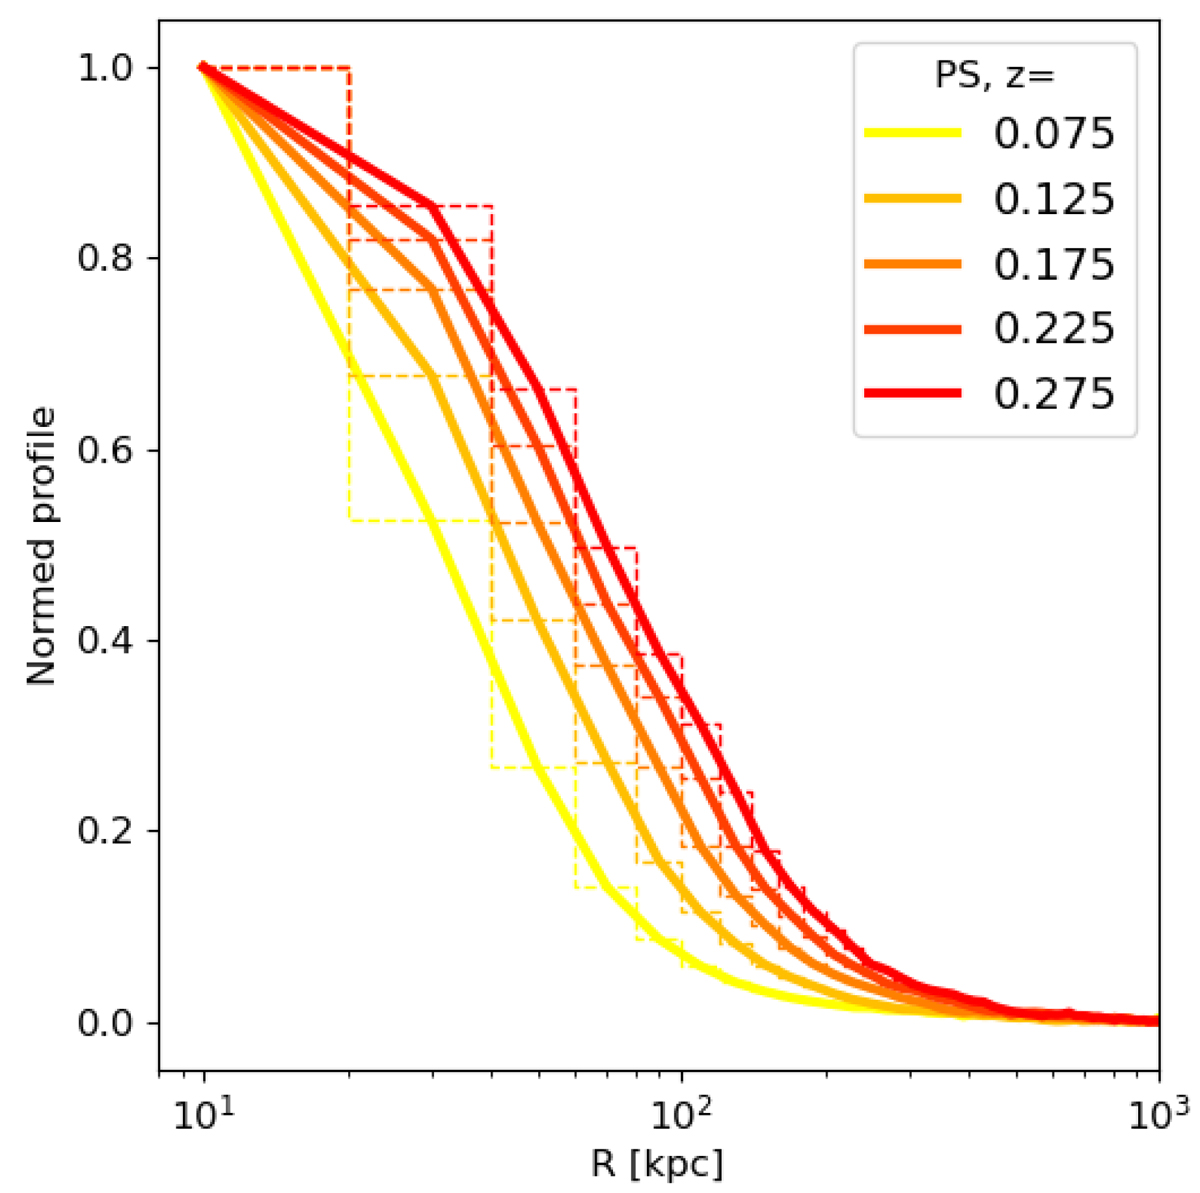
Download original image
eROSITA normalized point-source profiles as a function of redshift in bins of 20 kpc. Each curve represents the average point-source profile in a redshift bin of width of 0.05: 0.05–0.1, 0.1–0.15, 0.15–0.2, 0.2–0.25, 0.25–0.3. The labeled number gives the mean redshift of the bin. At the mean redshift of the sample (z ∼ 0.2), the half width at half maximum (HWHM) of the empirical PSF corresponds to about 60 kpc.
Current usage metrics show cumulative count of Article Views (full-text article views including HTML views, PDF and ePub downloads, according to the available data) and Abstracts Views on Vision4Press platform.
Data correspond to usage on the plateform after 2015. The current usage metrics is available 48-96 hours after online publication and is updated daily on week days.
Initial download of the metrics may take a while.