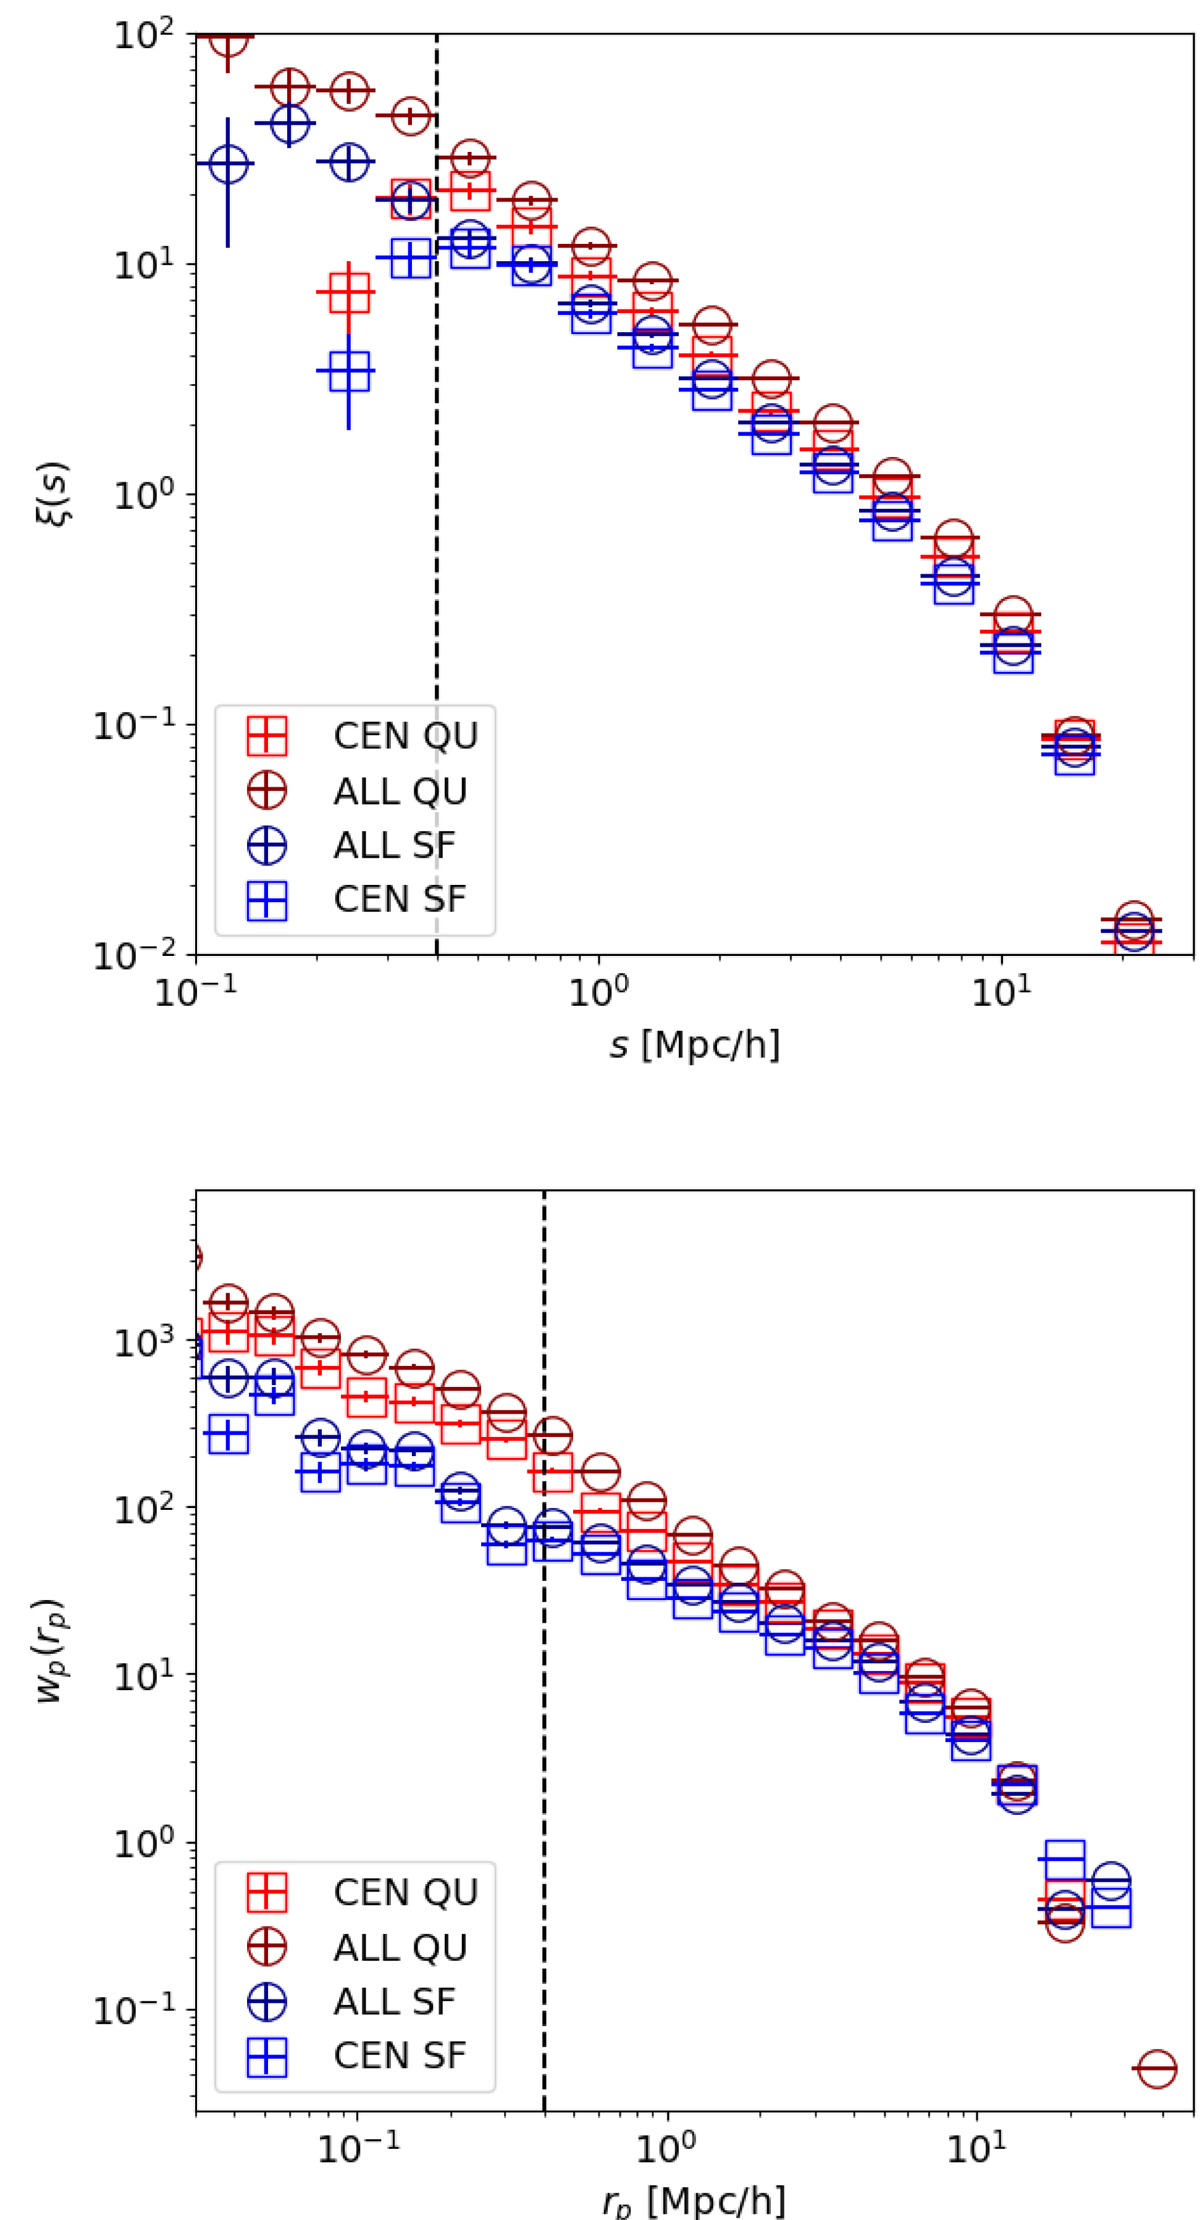
Fig. 11.
Download original image
Clustering of the samples selected. In each panel we show the results for the quiescent central galaxies (CEN QU, red squares), the star-forming centrals (SF CEN, blue squares), all the quiescent galaxies (ALL QU, purple circles), and all the star-forming ones (ALL SF, dark blue circles). Top panel: three-dimensional correlation function. The turn over due to the central selection function is clear, as illustrated by the vertical dashed line. Bottom panel: projected correlation function: no turnover is visible.
Current usage metrics show cumulative count of Article Views (full-text article views including HTML views, PDF and ePub downloads, according to the available data) and Abstracts Views on Vision4Press platform.
Data correspond to usage on the plateform after 2015. The current usage metrics is available 48-96 hours after online publication and is updated daily on week days.
Initial download of the metrics may take a while.