Fig. 10.
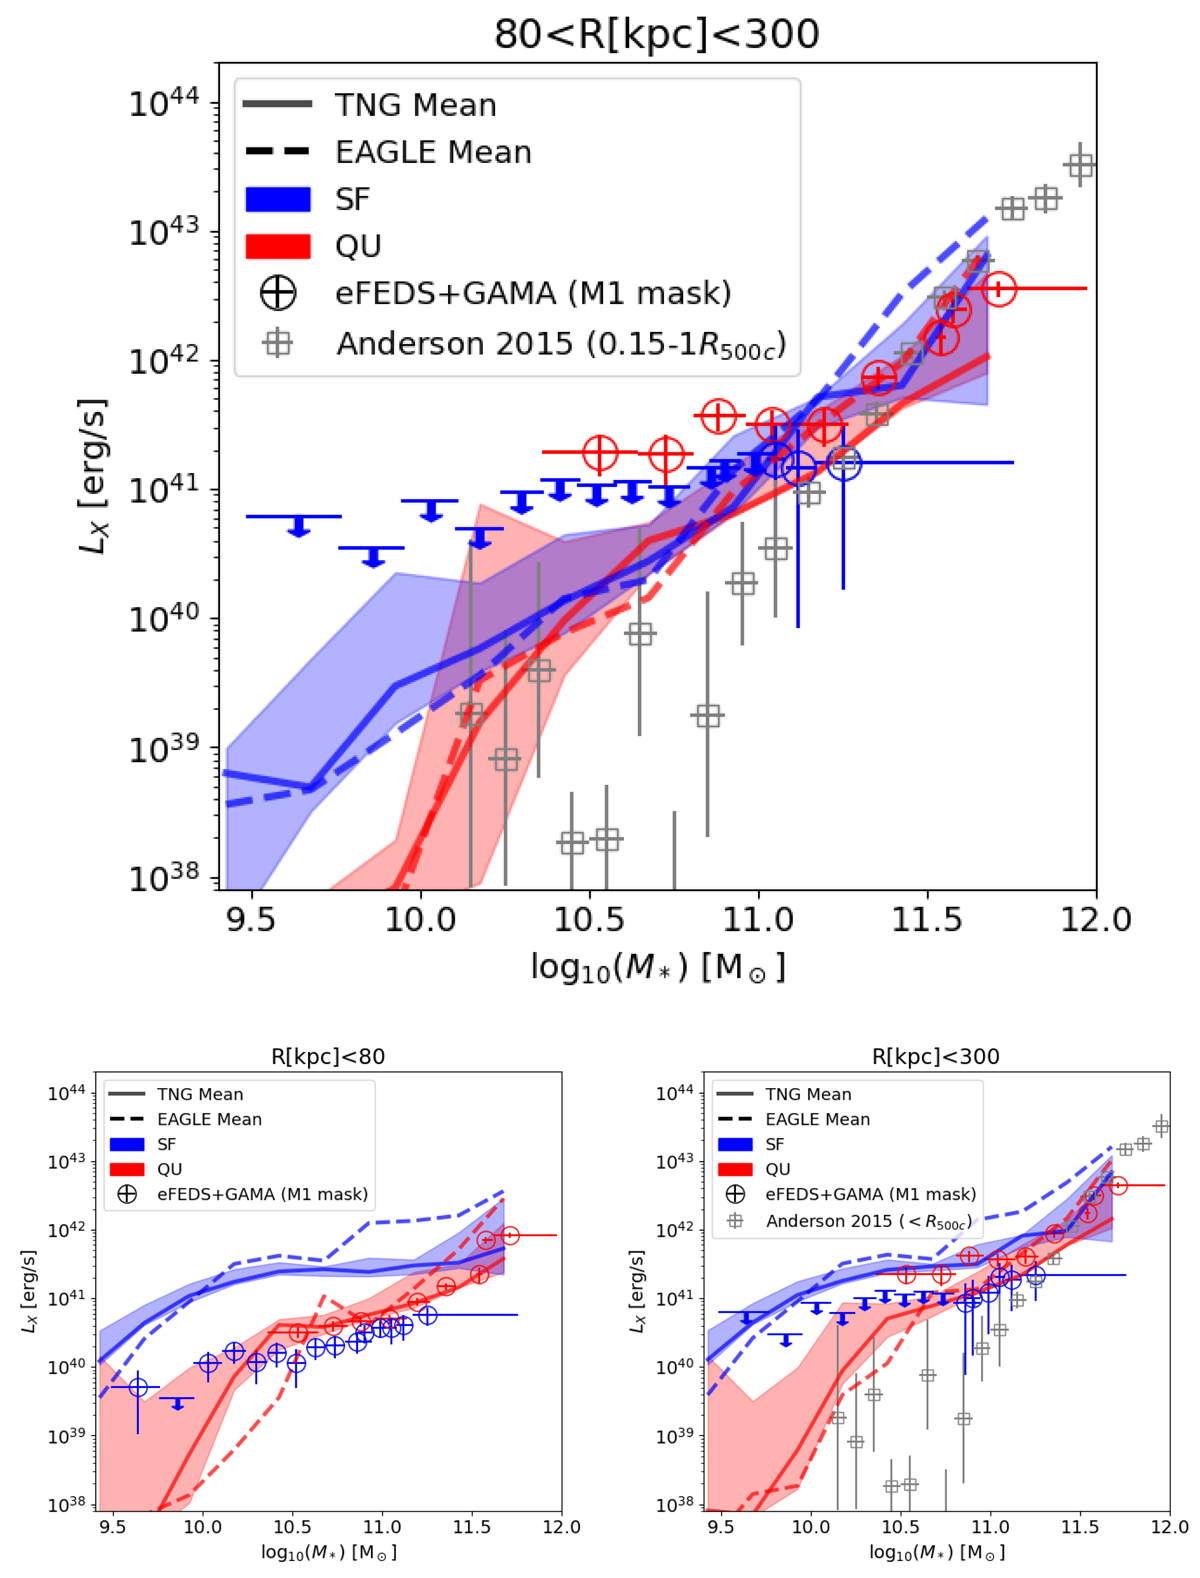
Download original image
Same as Fig. 7 but with the addition of the predictions from the TNG100 and EAGLE simulations of matched galaxies. Shaded regions give the order of magnitude of the systematic uncertainty due to the process used to create mock observations. Shaded regions are shown for the TNG simulation. For EAGLE, shaded regions should have a similar width, but they are not shown so as to not overcrowd the figure. We show the observed and predicted soft X-ray luminosity from the central 80 kpc (bottom left) from the full 300 kpc (bottom right) and for the 80 < Rp < 300 kpc range (main top panel) as a function of galaxy stellar mass.
Current usage metrics show cumulative count of Article Views (full-text article views including HTML views, PDF and ePub downloads, according to the available data) and Abstracts Views on Vision4Press platform.
Data correspond to usage on the plateform after 2015. The current usage metrics is available 48-96 hours after online publication and is updated daily on week days.
Initial download of the metrics may take a while.