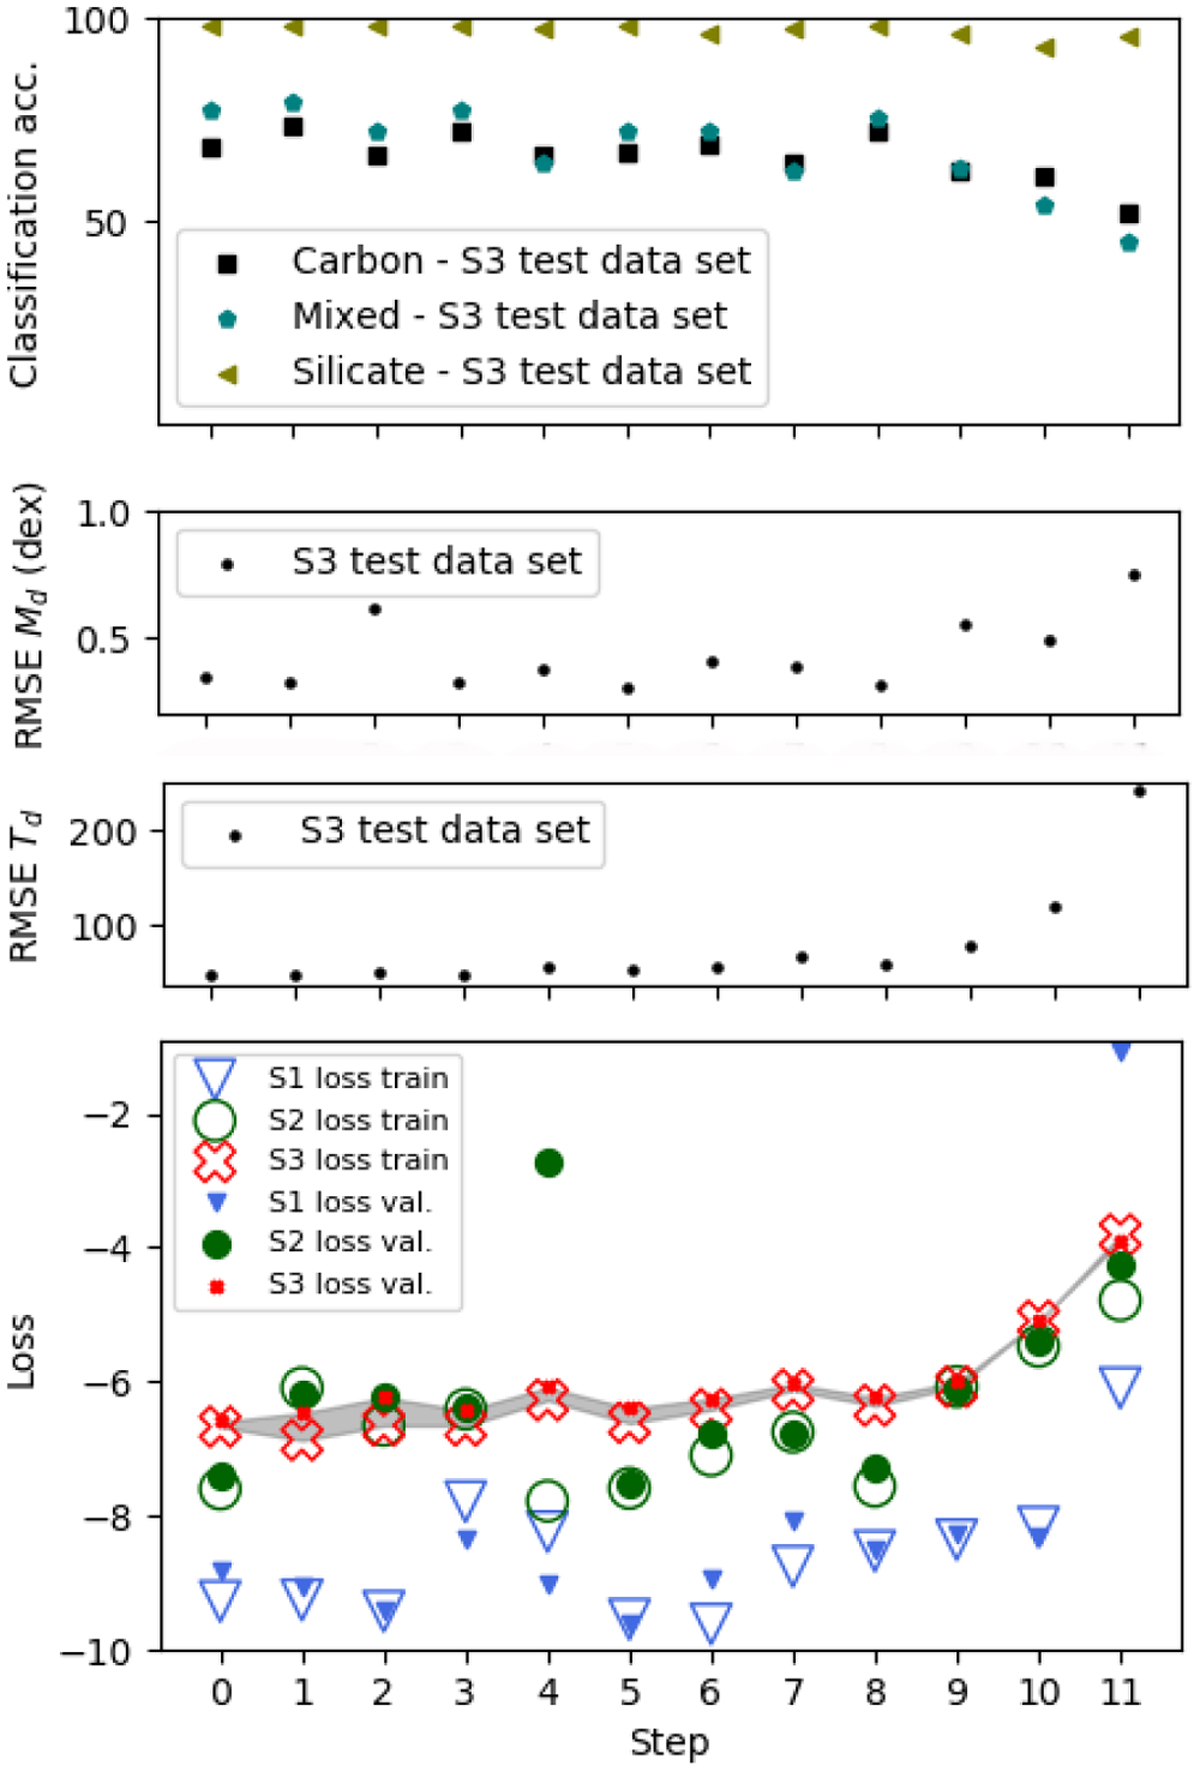
Fig. 7
Download original image
Performance of our neural network with each filter set that are obtained at each step of the feature selection process. Bottom panel: loss values that are achieved by the training and validation data sets at the end of each training process of the neural network in S1 (downward triangles), S2 (circles), and S3 (X symbols). The empty symbols mark the training loss for each step. The filled symbols mark the validation loss for each step. The grey shaded region represents the area between the training and validation loss in S3. The single panels show the RMSE of Tdust (K), and Mdust (M⊙), and the classification accuracy (%) for predicting the dust species for the test data sets in S3, from bottom to top. The classification accuracy for predicting carbon and silicate dust species, and a mixture of them are shown with circles, triangles, and dashes respectively.
Current usage metrics show cumulative count of Article Views (full-text article views including HTML views, PDF and ePub downloads, according to the available data) and Abstracts Views on Vision4Press platform.
Data correspond to usage on the plateform after 2015. The current usage metrics is available 48-96 hours after online publication and is updated daily on week days.
Initial download of the metrics may take a while.