Fig. 3
Download original image
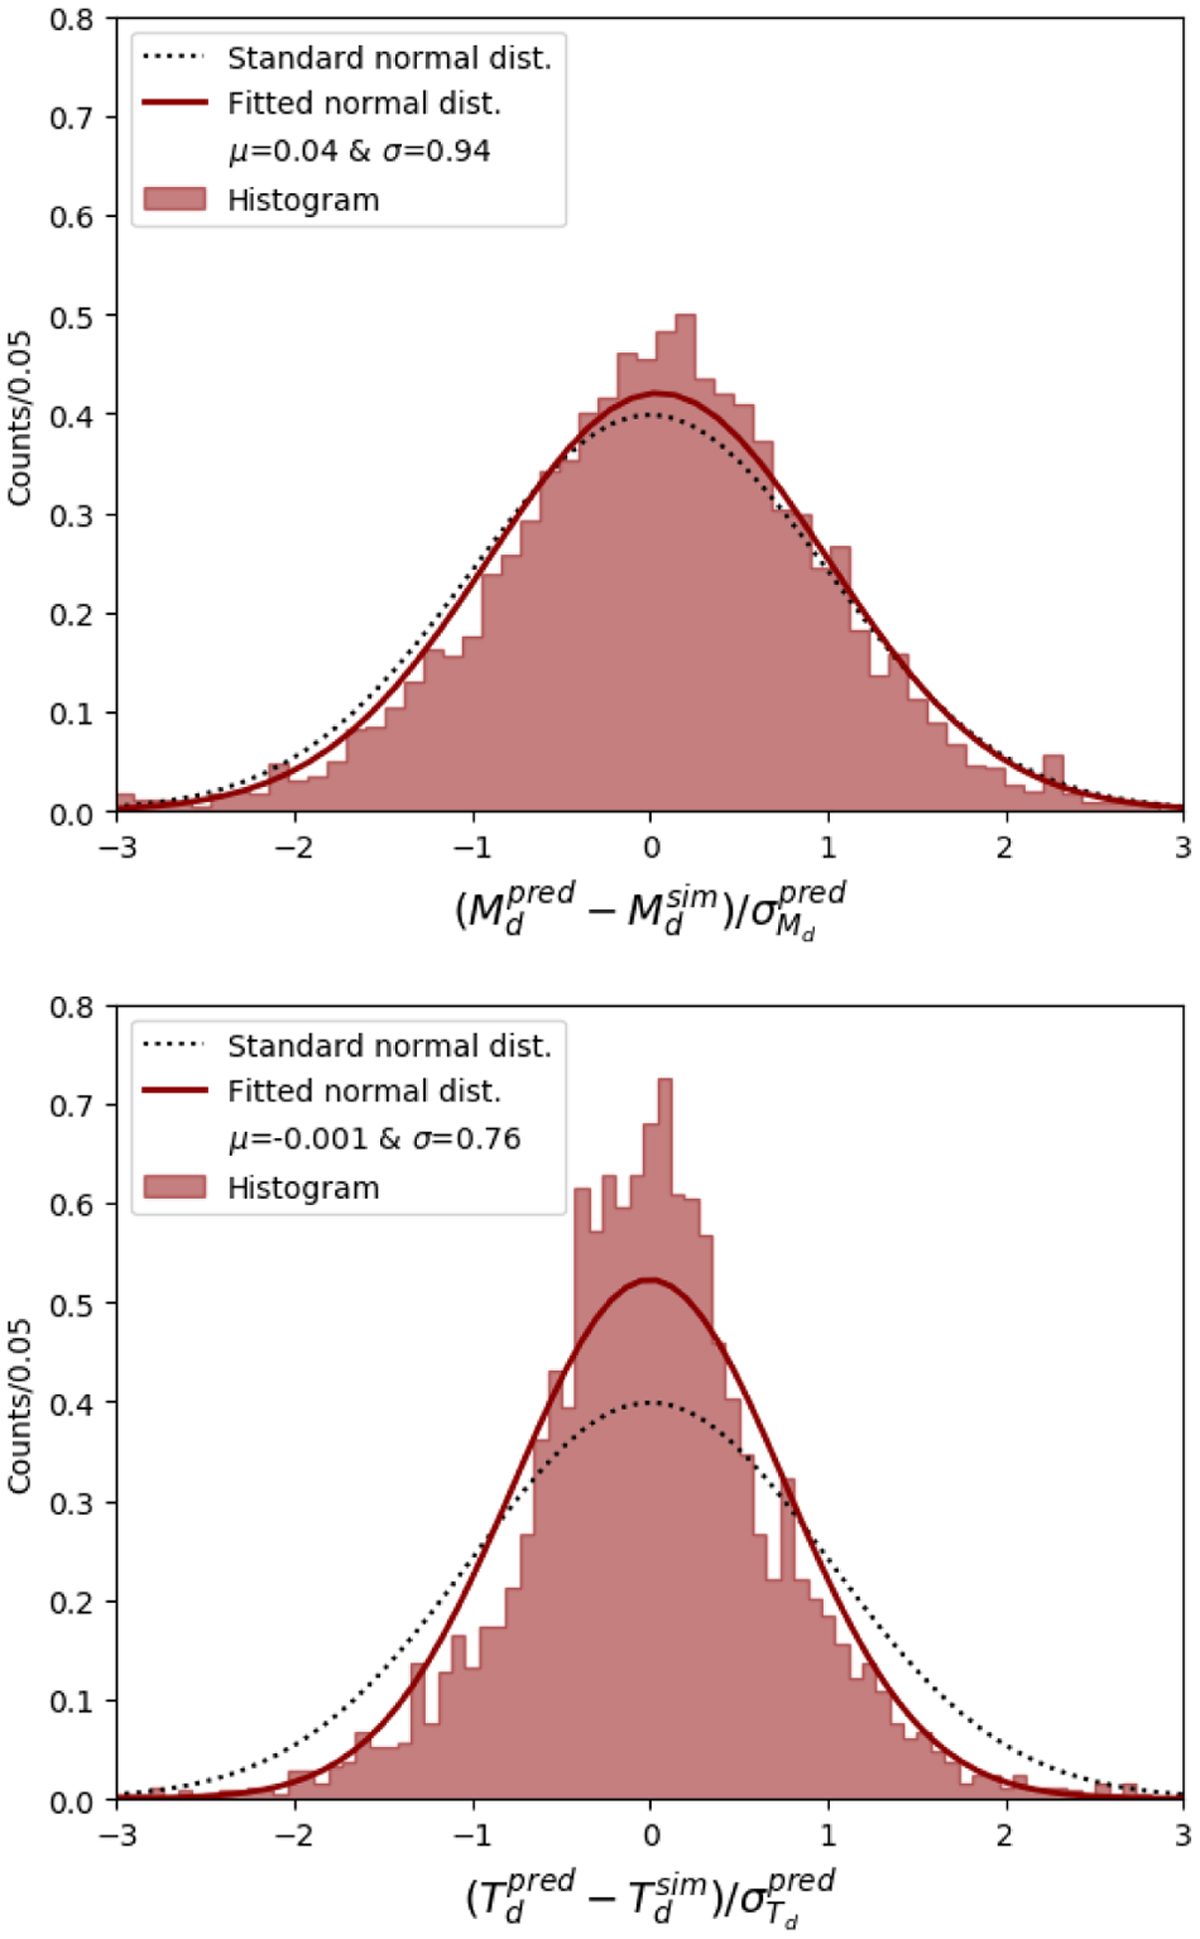
Comparison of the distribution of normalised prediction errors to a standard normal distribution. The histograms represent the distributions of (ypred − ysim)/σpred for Mdust (top panel), and Tdust (bottom panel), for a test data set predicted by the trained neural network with the entire suite of JWST filters, in S3. The dotted curves represent the standard normal distributions (i.e. N(0,1)). The solid curves are the normal distributions fitted to each of the histograms with µ = 0.04 and σ = 0.94 for Mdust, and µ = −0.001 and σ = 0.76 for Tdust.
Current usage metrics show cumulative count of Article Views (full-text article views including HTML views, PDF and ePub downloads, according to the available data) and Abstracts Views on Vision4Press platform.
Data correspond to usage on the plateform after 2015. The current usage metrics is available 48-96 hours after online publication and is updated daily on week days.
Initial download of the metrics may take a while.