Fig. 12
Download original image
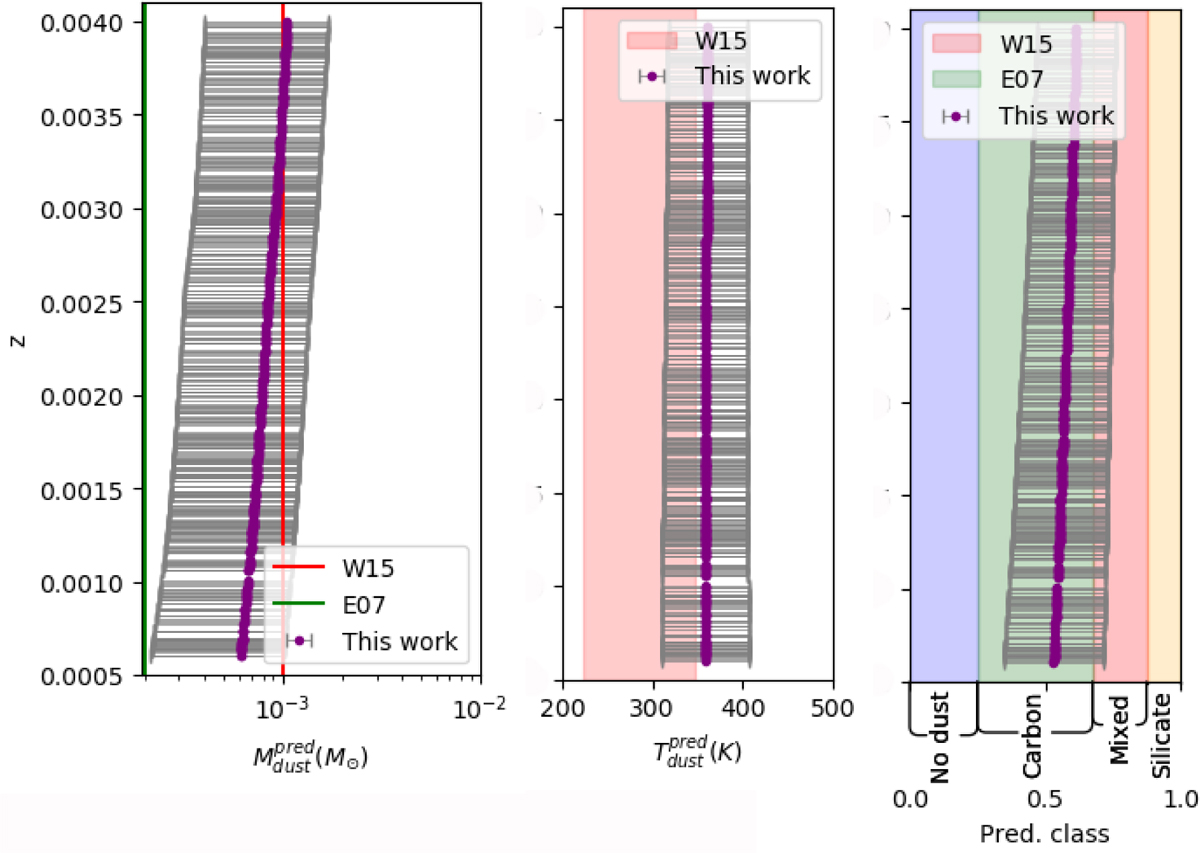
Estimated amount, temperature, and composition of the dust in SN 1987A at 615 days after explosion for the entire set of JWST filters. The purple dots along with black lines represent the predicted values and the predicted uncertainties by the trained neural network, respectively. The estimated values by (Wesson et al. 2015, W15) and (Ercolano et al. 2007, E07) are shown as red and green solid lines (left panel) and shaded areas (middle and right panels). The blue and yellow regions in the right panel highlight x-axis labels; No dust and Silicate.
Current usage metrics show cumulative count of Article Views (full-text article views including HTML views, PDF and ePub downloads, according to the available data) and Abstracts Views on Vision4Press platform.
Data correspond to usage on the plateform after 2015. The current usage metrics is available 48-96 hours after online publication and is updated daily on week days.
Initial download of the metrics may take a while.