Fig. 3
Download original image
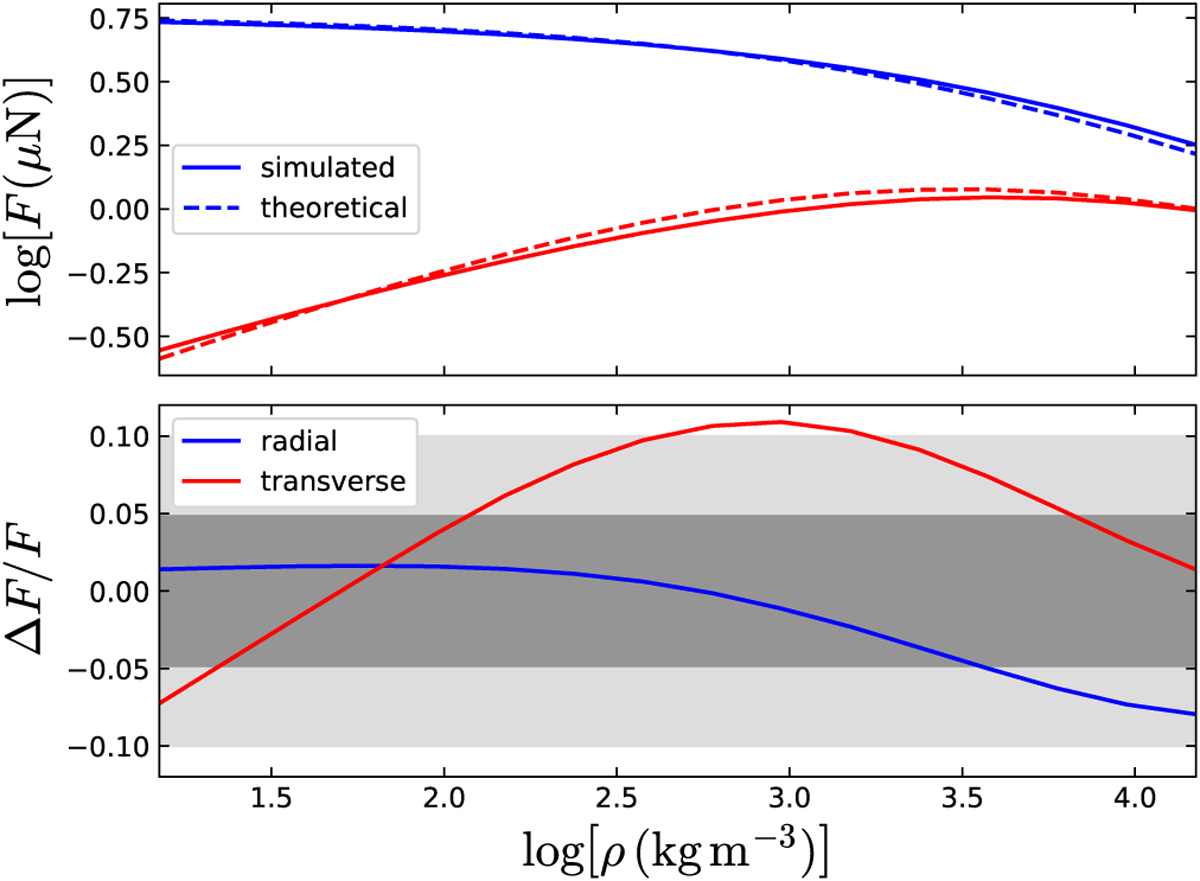
Comparisons of the Yarkovsky forces derived from the linear model (theoretical) and numerical simulations for varying density ρ. Upper panel: forces (blue for radial and red for transverse components) versus ρ. Solid curves refer to simulated results while dashed curves are for the linear model. Lower panel: fractional differences between the results from two methods. Blue and red curves are for the radial and transverse components, while grey and light-grey areas indicate the difference of less than 5 and 10%, respectively.
Current usage metrics show cumulative count of Article Views (full-text article views including HTML views, PDF and ePub downloads, according to the available data) and Abstracts Views on Vision4Press platform.
Data correspond to usage on the plateform after 2015. The current usage metrics is available 48-96 hours after online publication and is updated daily on week days.
Initial download of the metrics may take a while.