Open Access
Fig. 11
Download original image
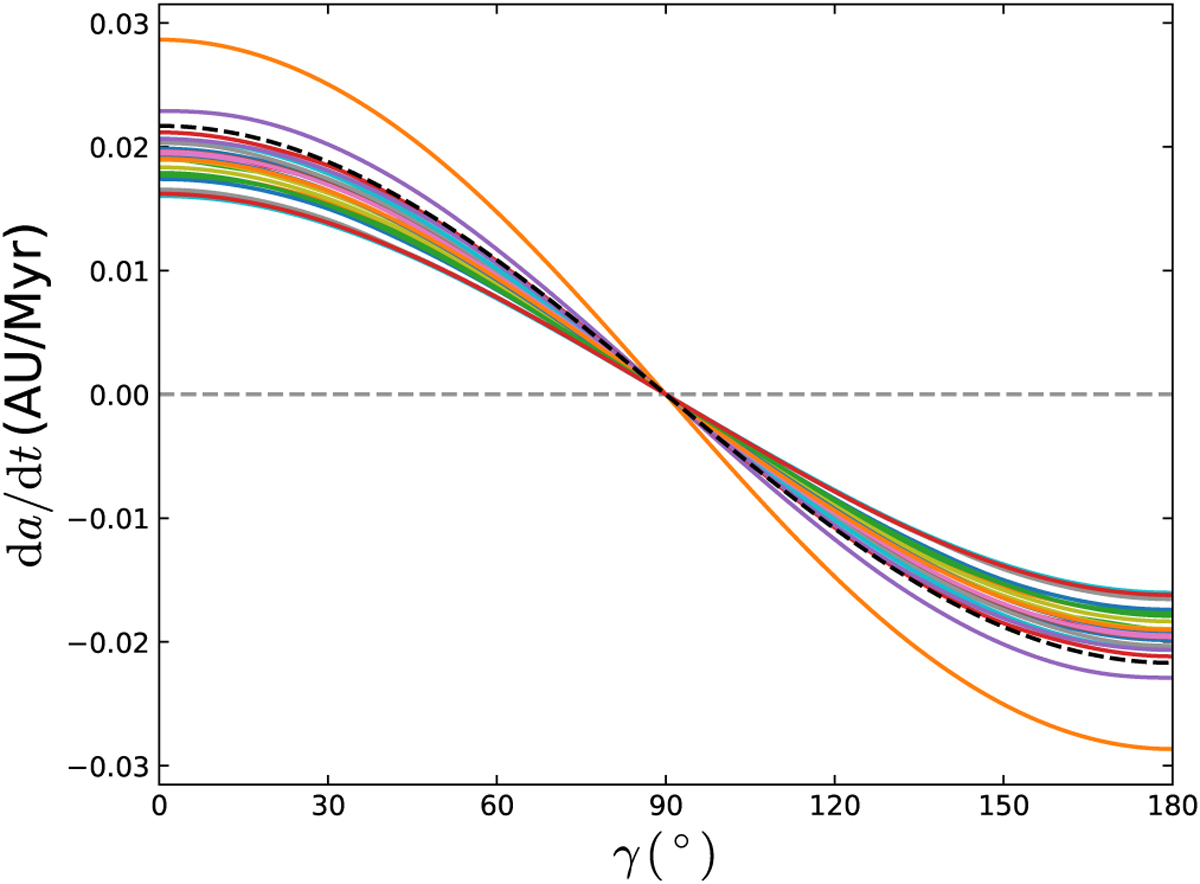
Rate of semimajor axis drift da/dt versus the obliquity of the spin axis γ. Solid curves represent simulated results for 34 asteroids of 10 m radius with real shapes while the dashed curve represents the analytical result from the linear model for a 10 m-radius sphere.
Current usage metrics show cumulative count of Article Views (full-text article views including HTML views, PDF and ePub downloads, according to the available data) and Abstracts Views on Vision4Press platform.
Data correspond to usage on the plateform after 2015. The current usage metrics is available 48-96 hours after online publication and is updated daily on week days.
Initial download of the metrics may take a while.