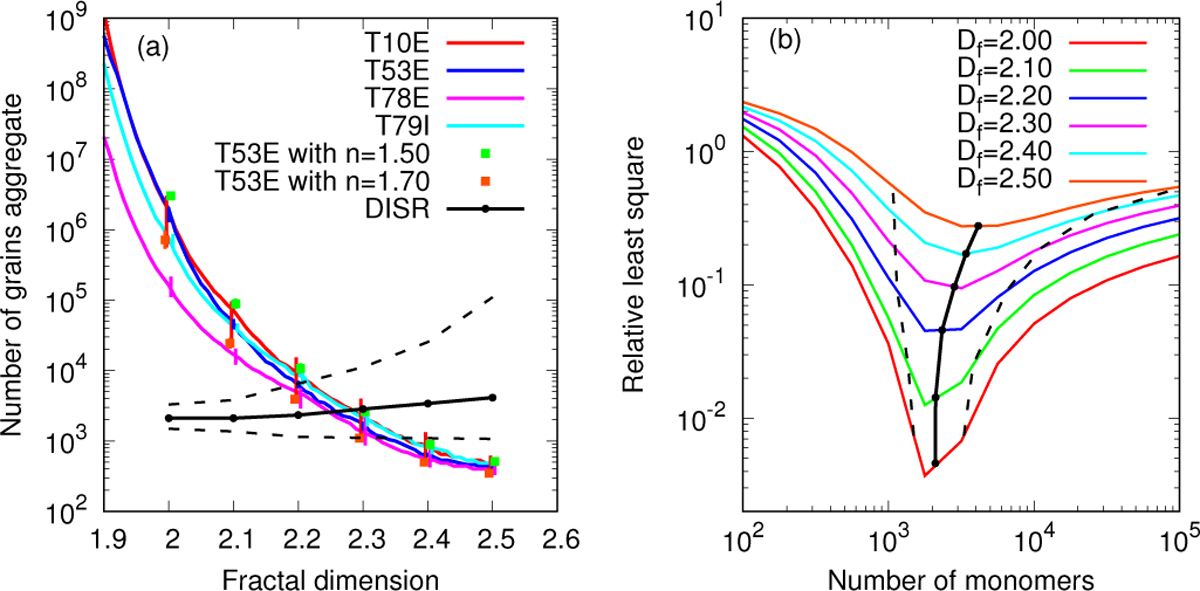
Fig. 8
Download original image
Parameters producing best fits for the four observations and for different fractal dimensions Df between 2.0 and 2.5. (a) Values of N obtained for the best fits of the spectral opacity (Fig. 7) as a function of Df. The constraints on N retrieved from the fit of the phase functions from DISR analysis are shown with black dots and dashed curves (reported from the graph (b)). (b) Relative least-square values for comparisons between phase functions derived with DISR (Tomasko et al. 2008) and phase functions computed for aggregates of various fractal dimensions and number of grains.
Current usage metrics show cumulative count of Article Views (full-text article views including HTML views, PDF and ePub downloads, according to the available data) and Abstracts Views on Vision4Press platform.
Data correspond to usage on the plateform after 2015. The current usage metrics is available 48-96 hours after online publication and is updated daily on week days.
Initial download of the metrics may take a while.