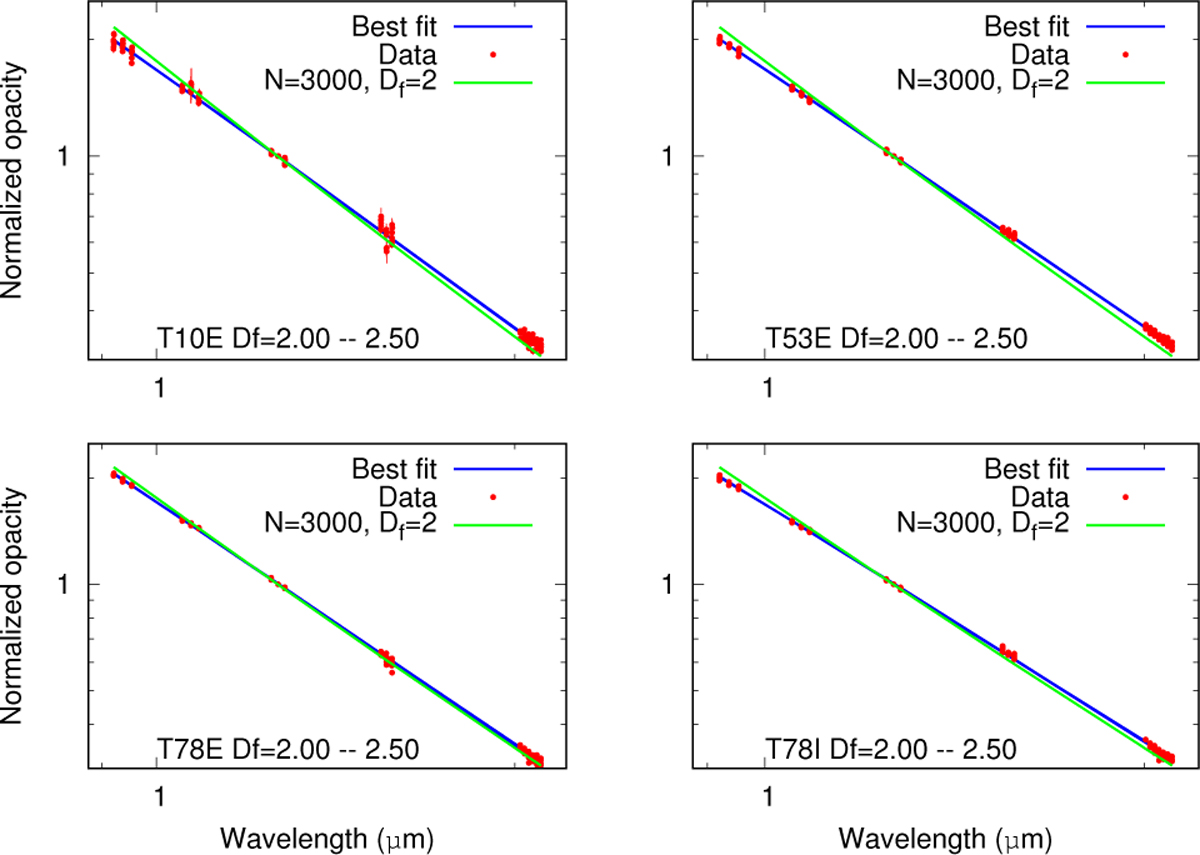
Fig. 7
Download original image
Best agreements obtained between data (scaled opacities between 200 and 300 km) and model for each observation. Good fits (blue line) can be obtained for any fractal dimension between 1.8 and 2.5, albeit with different values of N and κ. All these fits are superimposed (only cases between Df = 2 and 2.5 are reported here). The green line shows the opacity slope for aggregates with N = 3000 and Df = 2.0, as in Tomasko et al. (2008). This plot and Fig. 6 show that this structure of aggregates can be discarded.
Current usage metrics show cumulative count of Article Views (full-text article views including HTML views, PDF and ePub downloads, according to the available data) and Abstracts Views on Vision4Press platform.
Data correspond to usage on the plateform after 2015. The current usage metrics is available 48-96 hours after online publication and is updated daily on week days.
Initial download of the metrics may take a while.