Fig. 6
Download original image
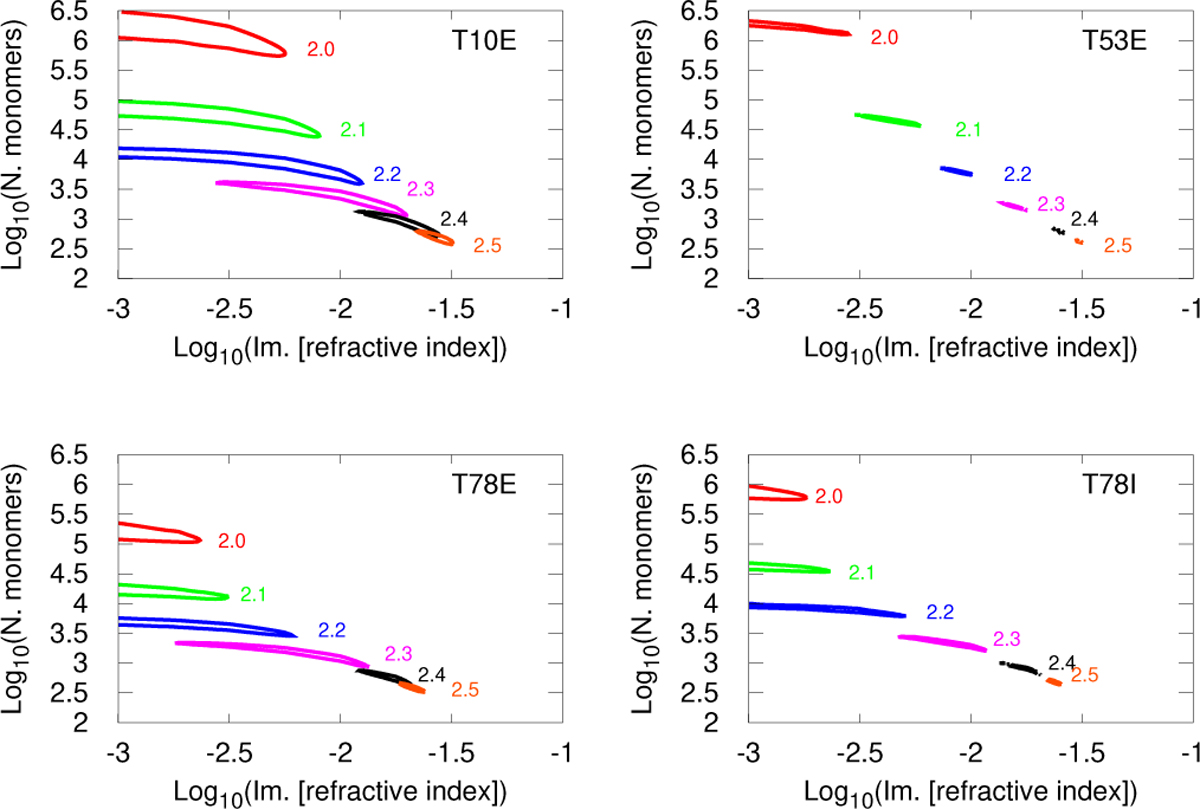
Maps of χ2 for fits of the haze continuum in windows as a function of the imaginary refractive index κ and of the number of grains per aggregate N for the four observations. The values of χ2 are adjusted for the minimum value of χ2 to be equal to the number of data minus the number of free parameters. This was necessary to be able to draw the 1σ error envelope, while there are differences in aerosol structure between different observations, as we later show. For clarity, we only show the contours of the 1σ error bars for fractal dimensions Df = 2, 2.1, 2.2, 2.3, 2.4, and 2.5.
Current usage metrics show cumulative count of Article Views (full-text article views including HTML views, PDF and ePub downloads, according to the available data) and Abstracts Views on Vision4Press platform.
Data correspond to usage on the plateform after 2015. The current usage metrics is available 48-96 hours after online publication and is updated daily on week days.
Initial download of the metrics may take a while.