Fig. 5
Download original image
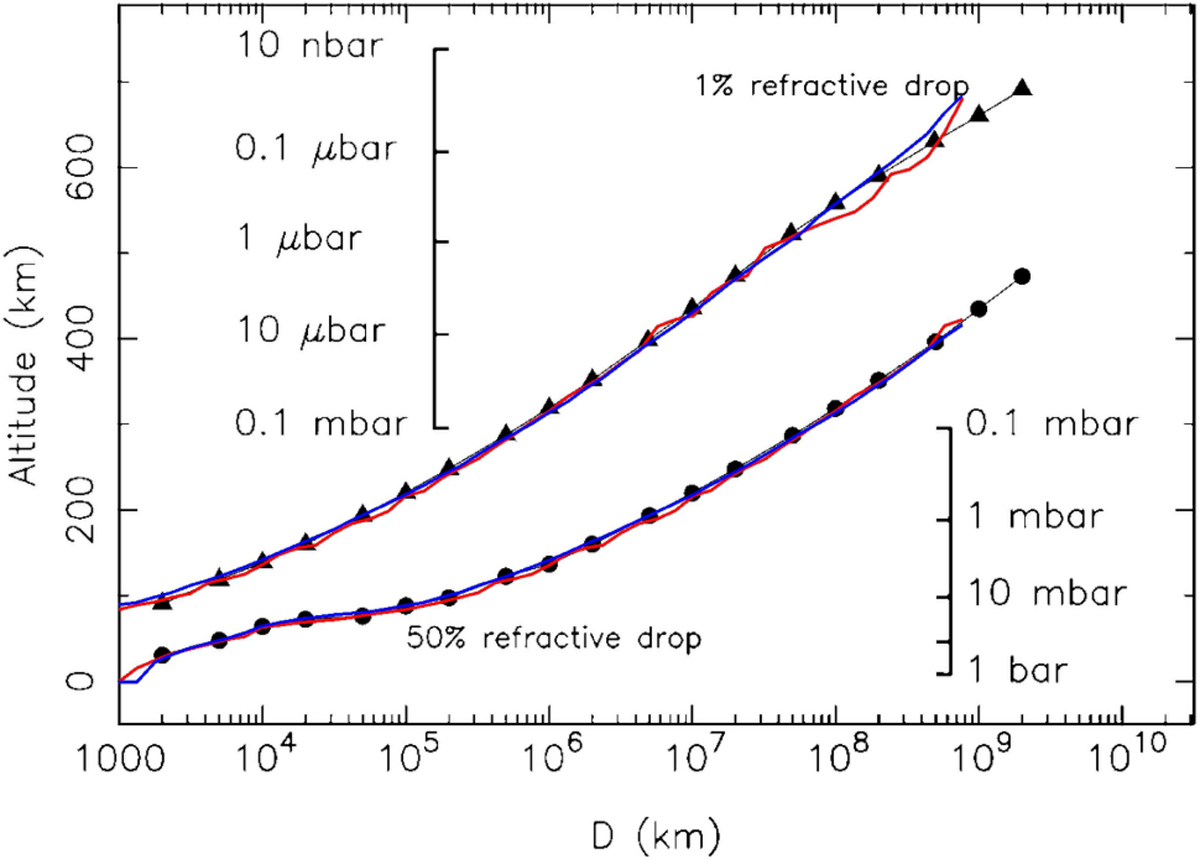
Altitude where transmitted flux is attenuated by 1 and 50% as a function of the distance D of Cassini to Titan. The distance for each observation is reported in Table 1. The shapes (triangles and dots) correspond to the evaluation made by Bellucci et al. (2009). The blue and red lines show our calculations using the pressure and temperature profiles retrieved by CIRS (flyby T51, 27 March 2009 at 1° S) and by HASI onboard Huygens Fulchignoni et al. (2005), respectively (figure based on Bellucci et al. 2009).
Current usage metrics show cumulative count of Article Views (full-text article views including HTML views, PDF and ePub downloads, according to the available data) and Abstracts Views on Vision4Press platform.
Data correspond to usage on the plateform after 2015. The current usage metrics is available 48-96 hours after online publication and is updated daily on week days.
Initial download of the metrics may take a while.