Fig. 3
Download original image
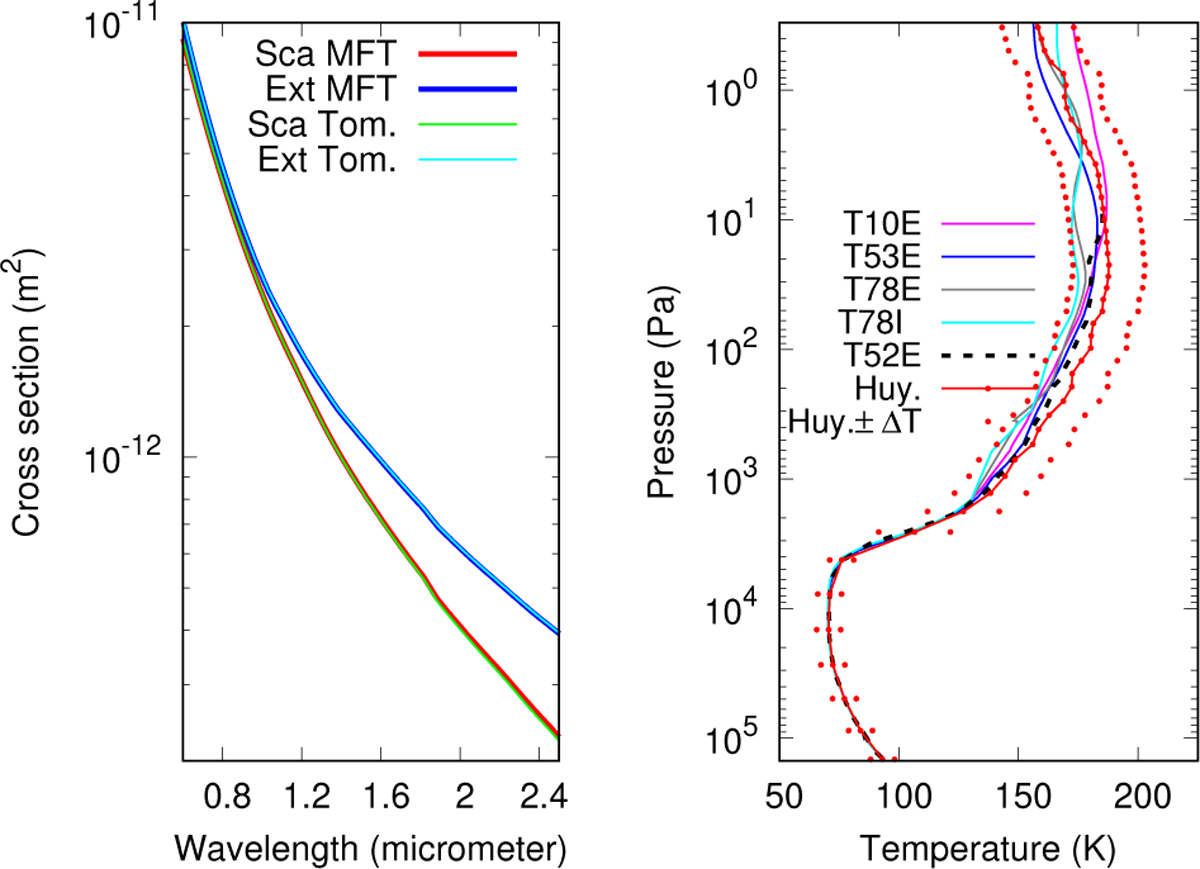
Preliminary control of model background properties: aerosol optical cross-sections and atmosphere temperature profiles Left: extinction (upper curves) and scattering (lower curves) cross-sections for an aggregate of 3000 monomers of radius 50 nm with a fractal dimension Df = 2, computed with the mean field approximation model (Botet et al. 1997; Rannou et al. 1997) and with the model used by Tomasko et al. (2008). Right: temperature profile as a function of pressure observed with HASI (Fulchignoni et al. 2005) and profiles based on HASI with a temperature shift ±∆T (red dots). We also plotted the temperature profiles after CIRS observations (Vinatier et al. 2015; Mathé et al. 2020) that best correspond to the dates and the latitudes of the occul-tations treated in this work (Table 1). The thick black dashed line shows the temperature profile retrieved by Schinder et al. (2020) with radio-occultation measurements during the flyby T52E (4 April 2009 at lat = 12°S).
Current usage metrics show cumulative count of Article Views (full-text article views including HTML views, PDF and ePub downloads, according to the available data) and Abstracts Views on Vision4Press platform.
Data correspond to usage on the plateform after 2015. The current usage metrics is available 48-96 hours after online publication and is updated daily on week days.
Initial download of the metrics may take a while.