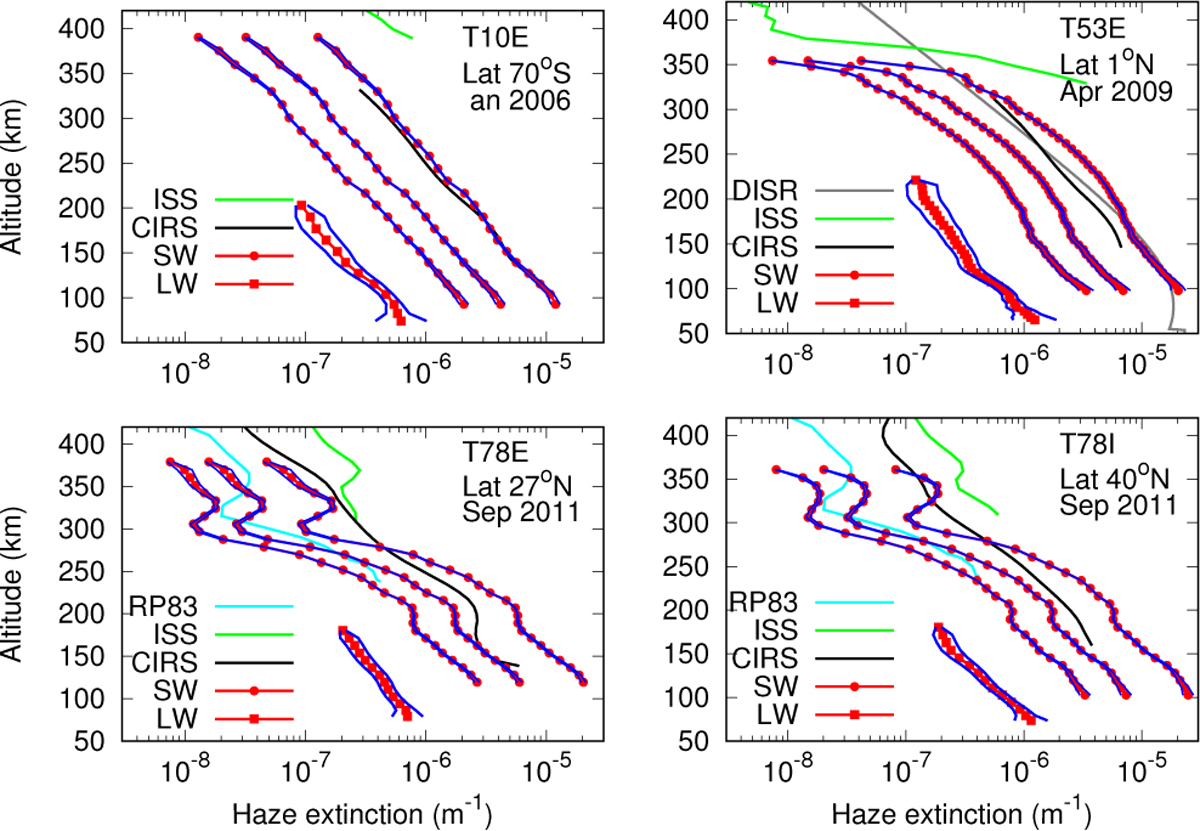
Fig. 18
Download original image
Same plots as in Fig. 9, but for short wavelengths (SW, thin red and blue lines and dots. From the right to the left, the wavelengths are 0.884 µm (channel #97), 1.540 µm (channel #137), and 2.199 µm (channel #177) along with the haze vertical profile at 5 µm (LW, thick red and blue lines and red squares). The red dots and squares are the retrieved values, and the blue lines show the 1σ envelope.
Current usage metrics show cumulative count of Article Views (full-text article views including HTML views, PDF and ePub downloads, according to the available data) and Abstracts Views on Vision4Press platform.
Data correspond to usage on the plateform after 2015. The current usage metrics is available 48-96 hours after online publication and is updated daily on week days.
Initial download of the metrics may take a while.