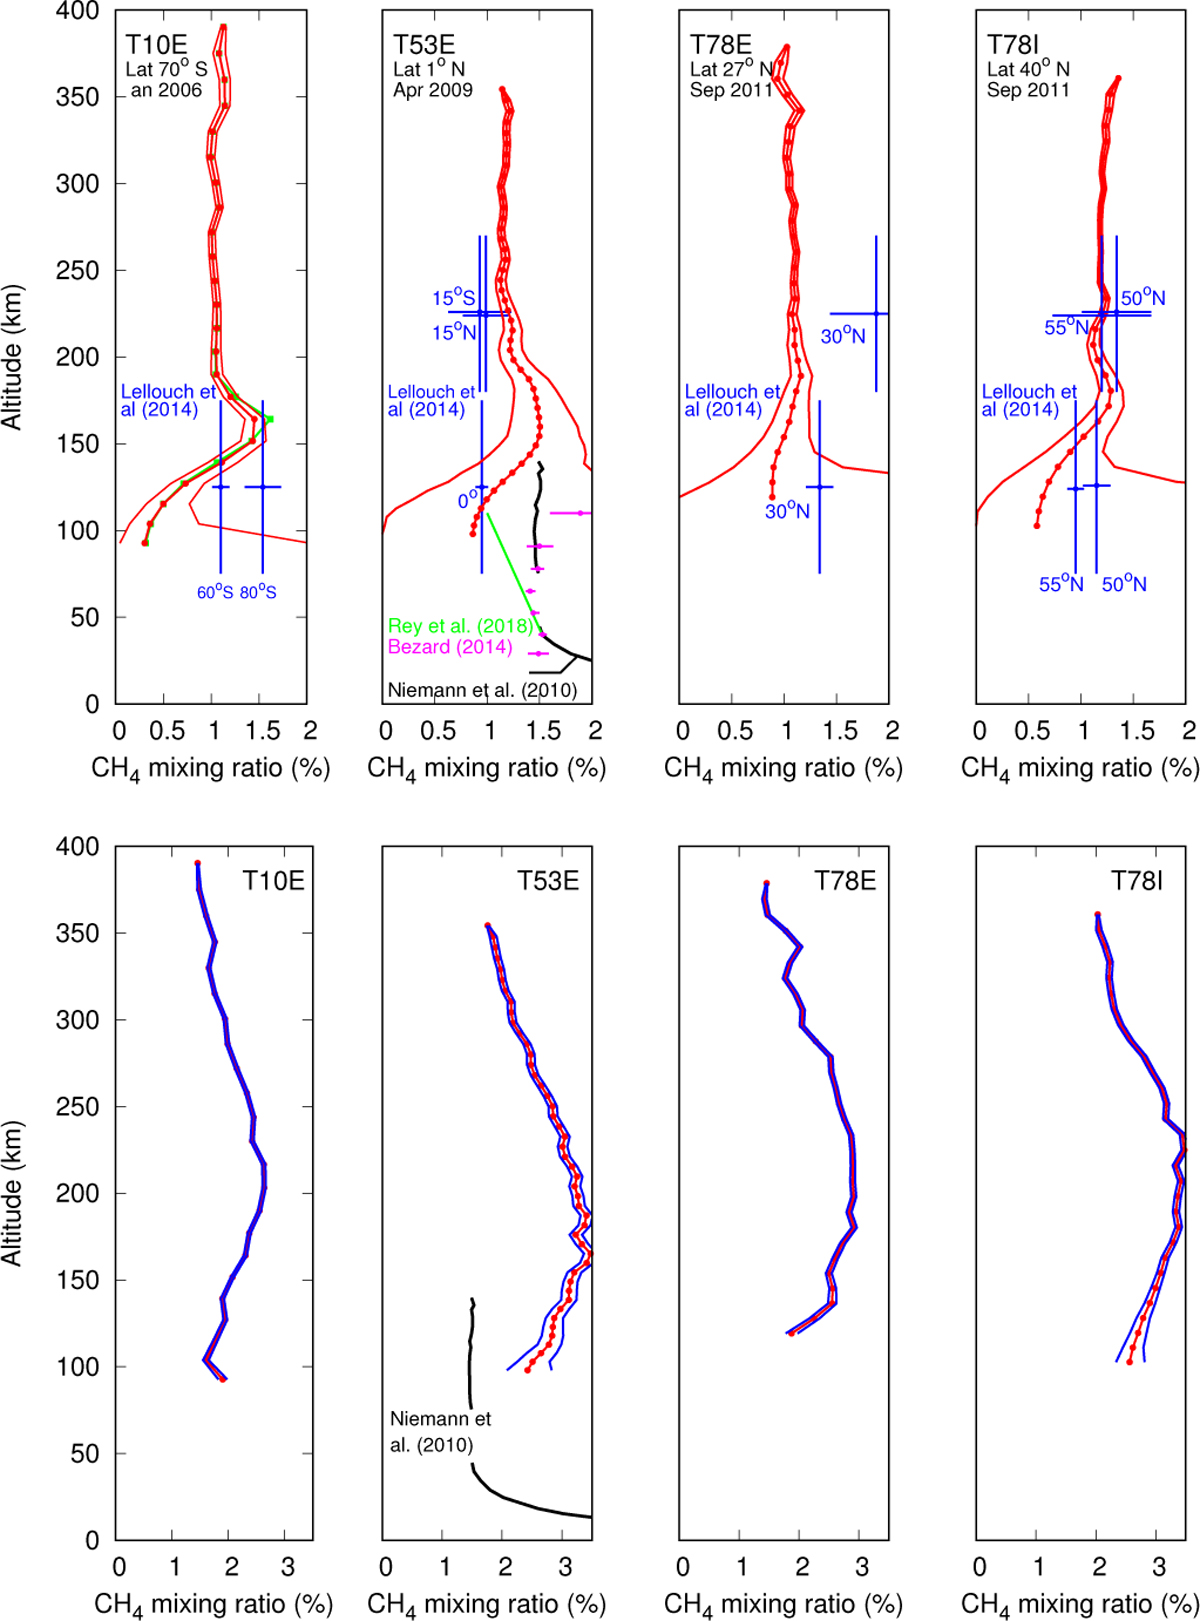
Fig. 11
Download original image
Methane mixing ratio retrieved with the four observation sets, with data between 0.88 and 2 µm (top) and between 2 and 2.8 µm (bottom). We also plot the methane mole fraction retrieved with the GCMS onboard Huygens (Niemann et al. 2010) and with DISR (Bézard 2014) and CIRS (Lellouch et al. 2014). The green dashed profile in the upper left graph shows the evaluation made by Rannou et al. (2021).
Current usage metrics show cumulative count of Article Views (full-text article views including HTML views, PDF and ePub downloads, according to the available data) and Abstracts Views on Vision4Press platform.
Data correspond to usage on the plateform after 2015. The current usage metrics is available 48-96 hours after online publication and is updated daily on week days.
Initial download of the metrics may take a while.