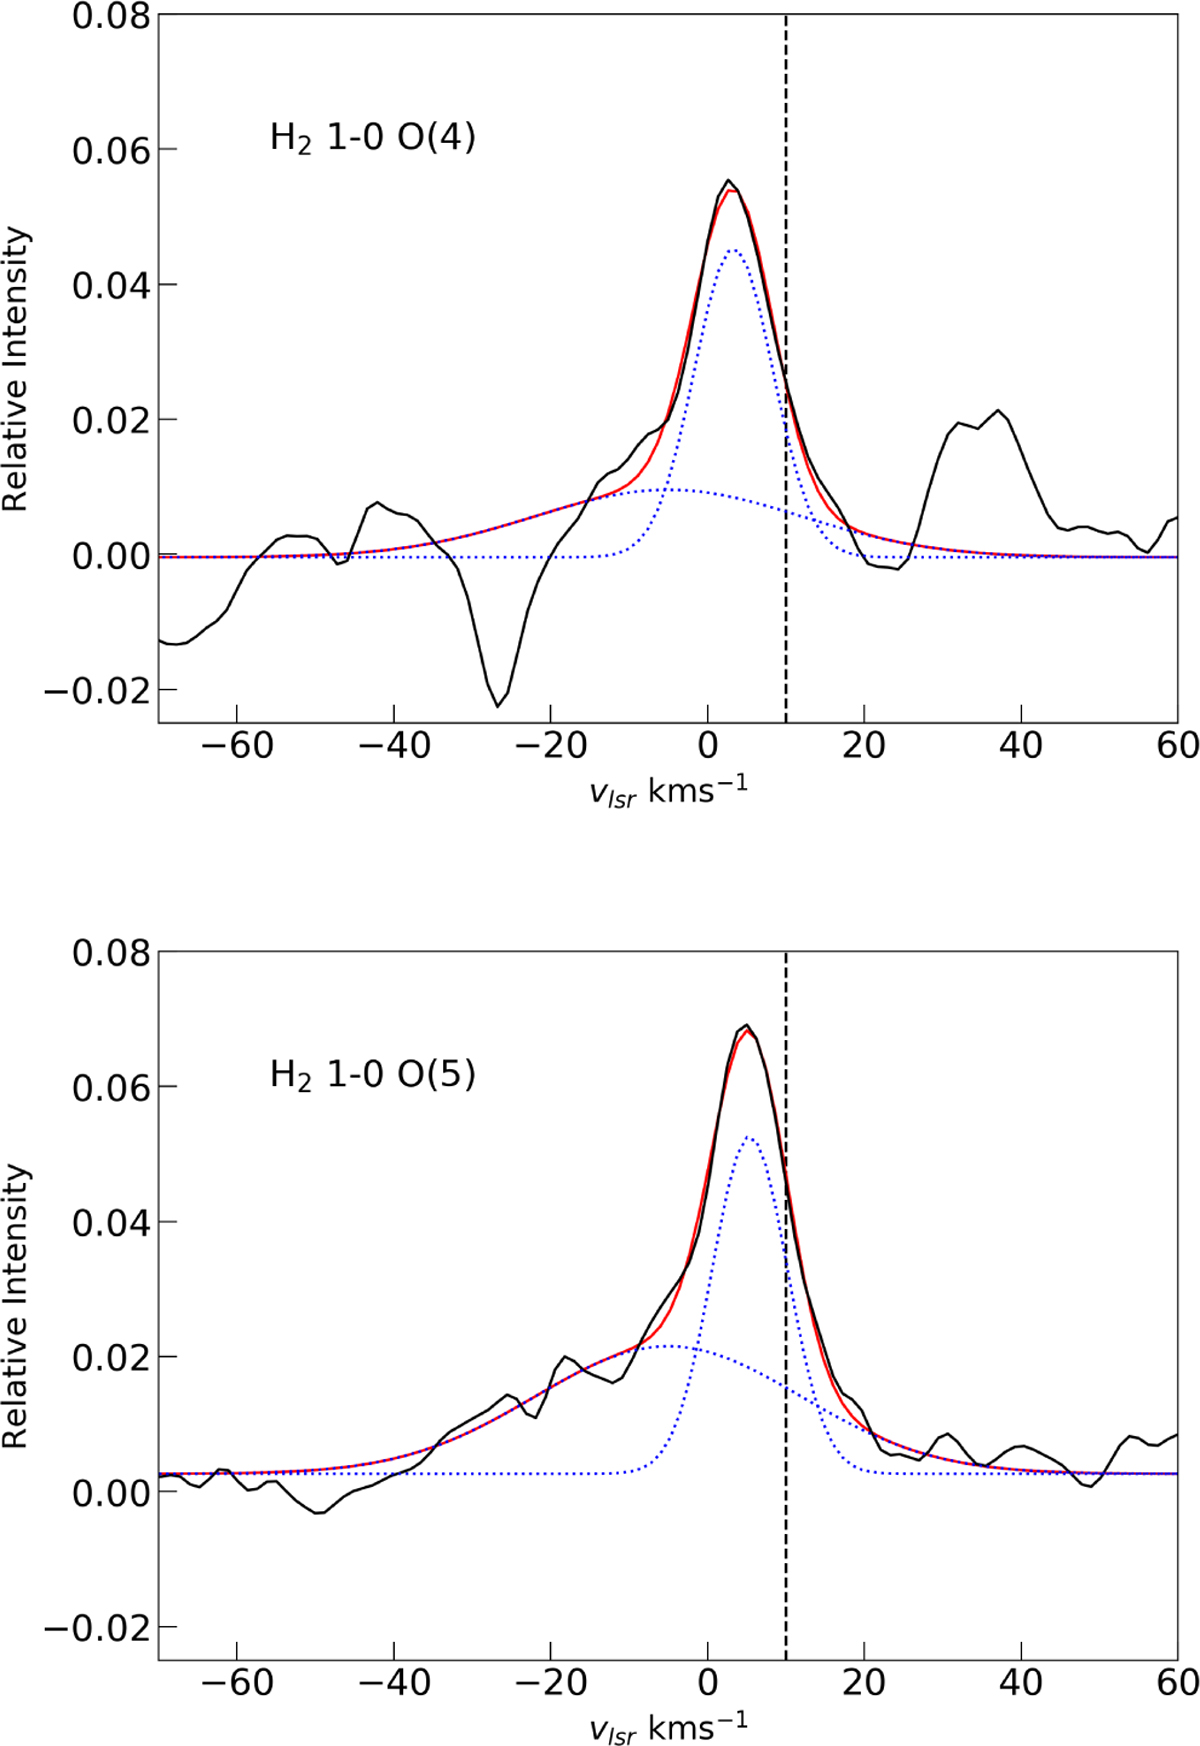
Fig. 8
Download original image
Emission lines of H2 detected towards MonR2 IRS 3A. The global fit in indicated in red, whereas the individual Gaussian components that make up this are show as dotted blue lines. The vertical dashed line denotes the cloud velocity of 10 km s−1 (van der Tak et al. 2003). The feature at 35 km s−1 in the left panel is the HCN R(5) line.
Current usage metrics show cumulative count of Article Views (full-text article views including HTML views, PDF and ePub downloads, according to the available data) and Abstracts Views on Vision4Press platform.
Data correspond to usage on the plateform after 2015. The current usage metrics is available 48-96 hours after online publication and is updated daily on week days.
Initial download of the metrics may take a while.