Open Access
Fig. 7
Download original image
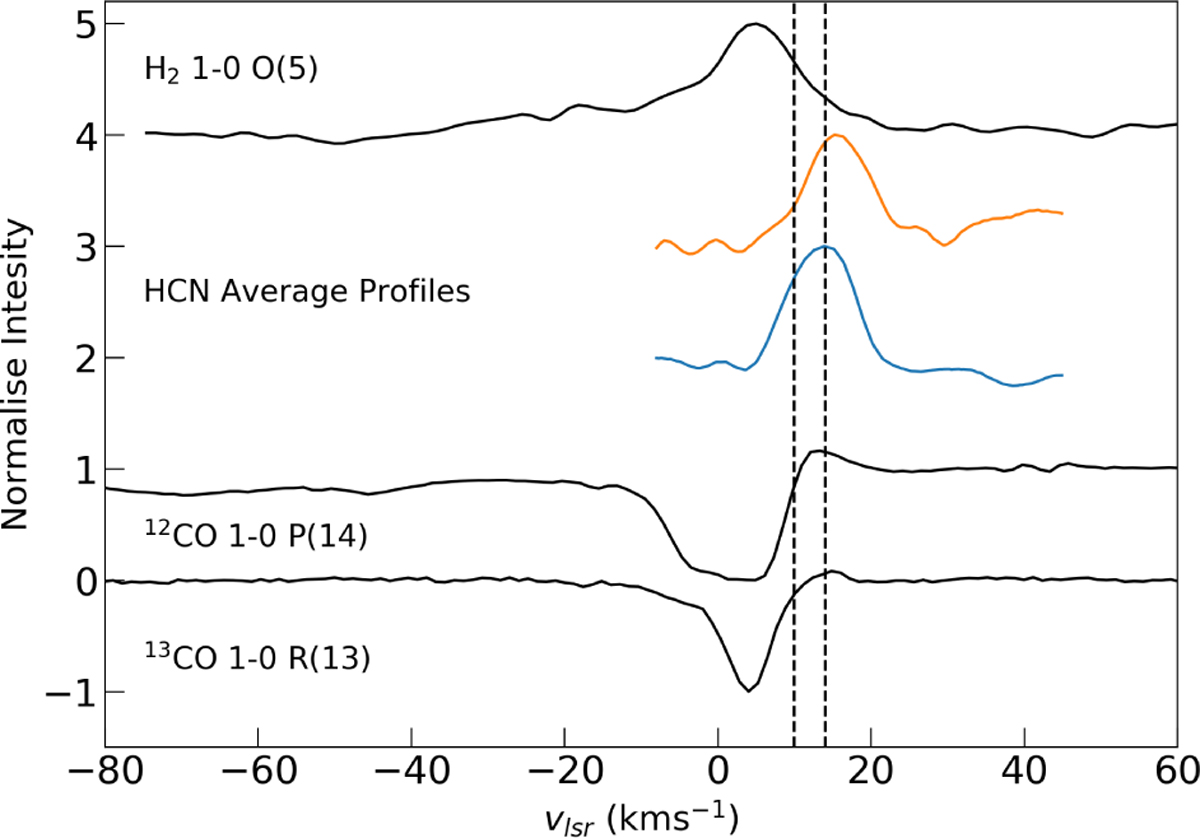
Normalised line profiles of CO, HCN and H2 from MonR2 IRS 3A. The orange and blue lines indicate the low and high J average profiles of HCN respectively. Finally the vertical dashed lines are at 10 km s−1 and 14 km s−1.
Current usage metrics show cumulative count of Article Views (full-text article views including HTML views, PDF and ePub downloads, according to the available data) and Abstracts Views on Vision4Press platform.
Data correspond to usage on the plateform after 2015. The current usage metrics is available 48-96 hours after online publication and is updated daily on week days.
Initial download of the metrics may take a while.