Fig. 6
Download original image
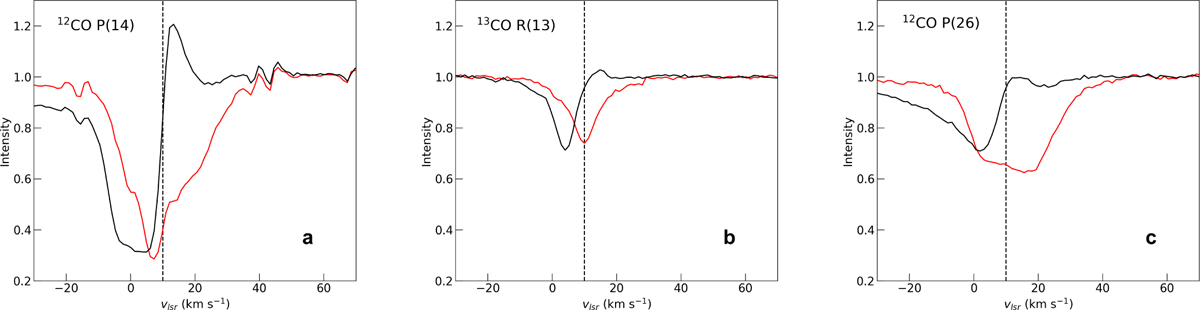
Line proflies from the 12CO and 13CO v = 1–0 band at 4.67 µm in the atmospheric M band (Lee et al., in prep.). The 12CO P(14), 13CO R(13) and 12CO P(26) lines are shown panels a, b and c respectively. The profiles in black and red originate from the 3A and 3B binary sources respectively. The dashed denotes the cloud velocity at 10 km s−1. The P Cygni profile is most obvious in the P(14) profile of the MonR2 IRS 3A source but actually present in all lines (Lee et al., in prep.).
Current usage metrics show cumulative count of Article Views (full-text article views including HTML views, PDF and ePub downloads, according to the available data) and Abstracts Views on Vision4Press platform.
Data correspond to usage on the plateform after 2015. The current usage metrics is available 48-96 hours after online publication and is updated daily on week days.
Initial download of the metrics may take a while.