Fig. 4
Download original image
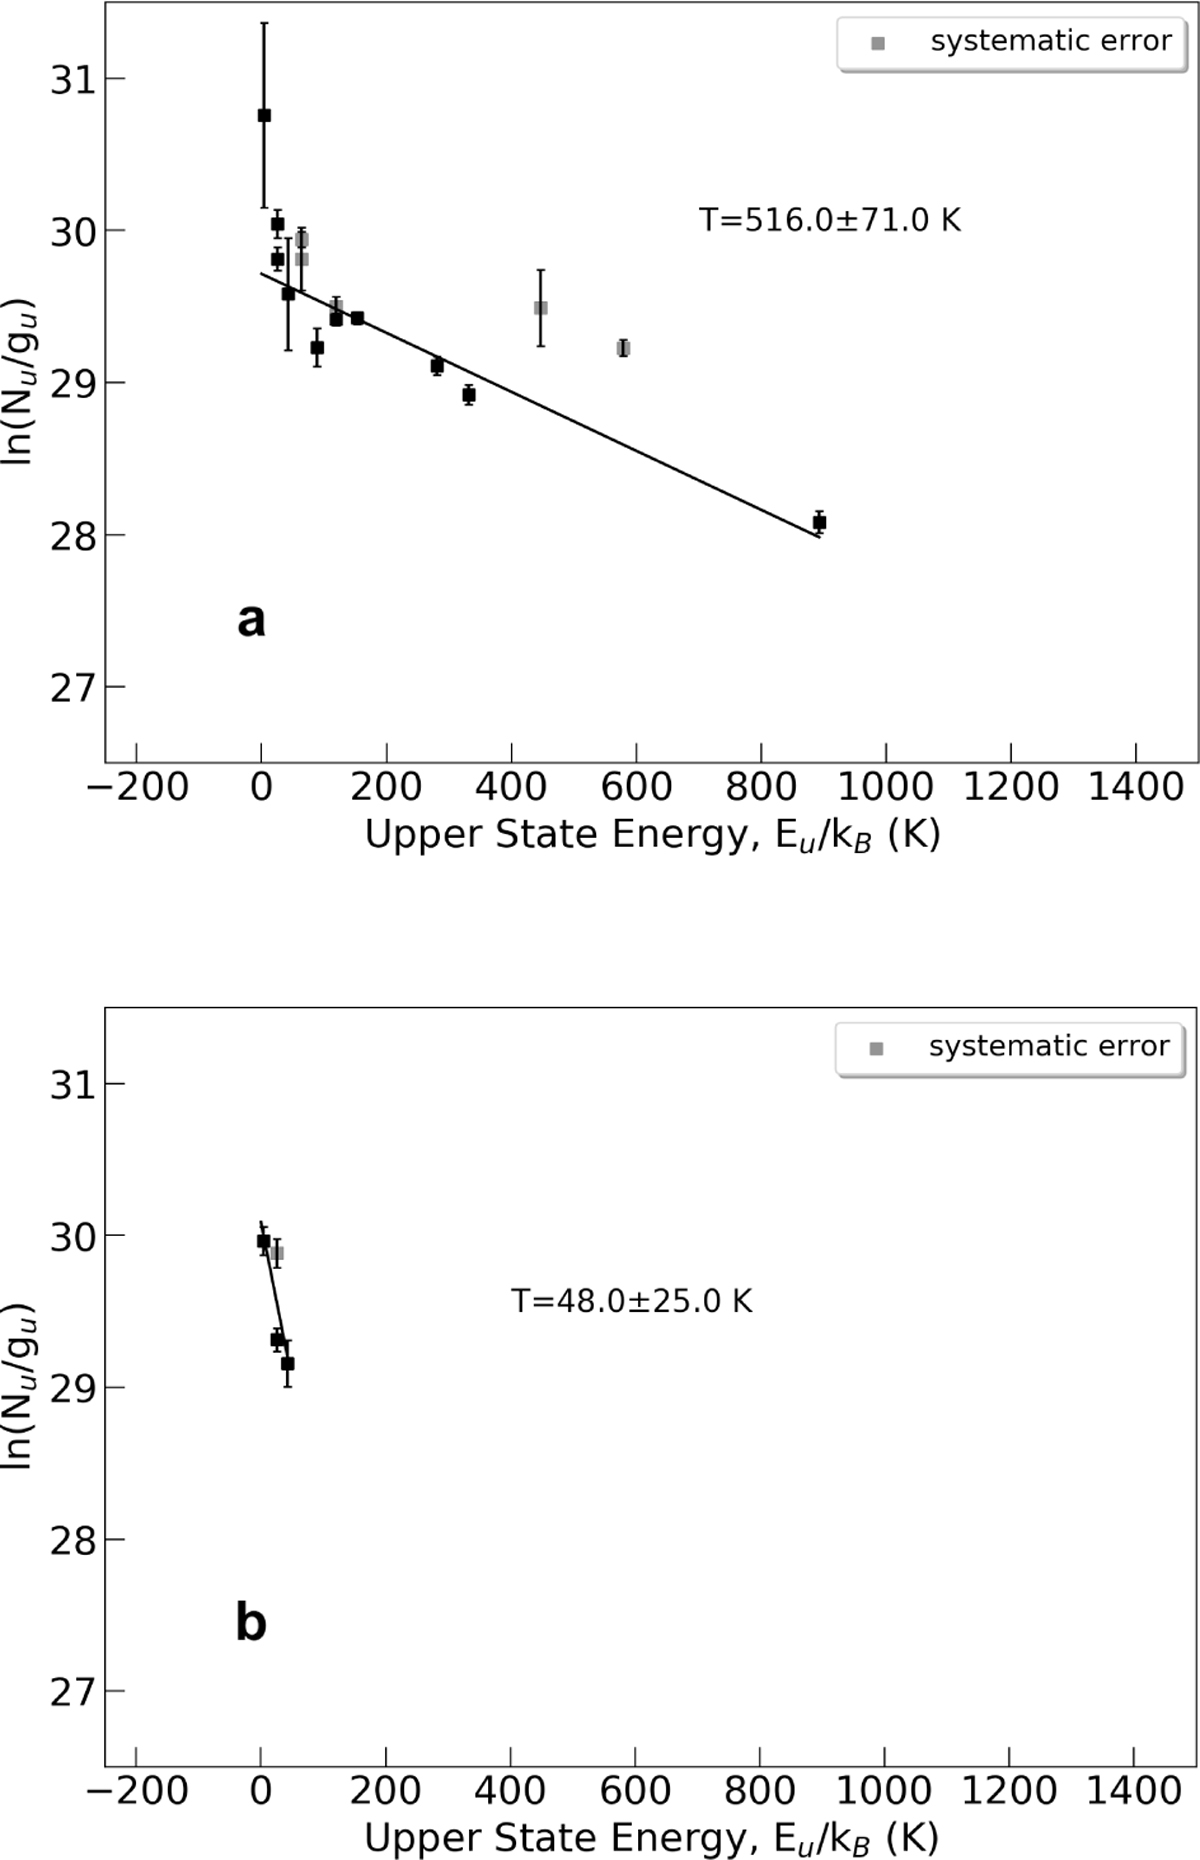
Rotation diagrams of HCN lines in the v1 band detected in MonR2 IRS 3A (panel a) and MonR2 IRS 3B (panel b). The error bars displayed are the 1σ error from the Gaussian fitting, however the error on the column of the R(1) and P(4) lines is estimated from the noise level. Emission lines of which the error is underestimated from the fitting routine due to systematic error in the data reduction process are indicated in grey. These transitions are excluded from the fit used to derive the physical conditions. The column density of the low J lines in MonR21RS 3A is calculated using the integrated line strengths without the contribution from the cloud at 9 km s−1.
Current usage metrics show cumulative count of Article Views (full-text article views including HTML views, PDF and ePub downloads, according to the available data) and Abstracts Views on Vision4Press platform.
Data correspond to usage on the plateform after 2015. The current usage metrics is available 48-96 hours after online publication and is updated daily on week days.
Initial download of the metrics may take a while.