Fig. 3
Download original image
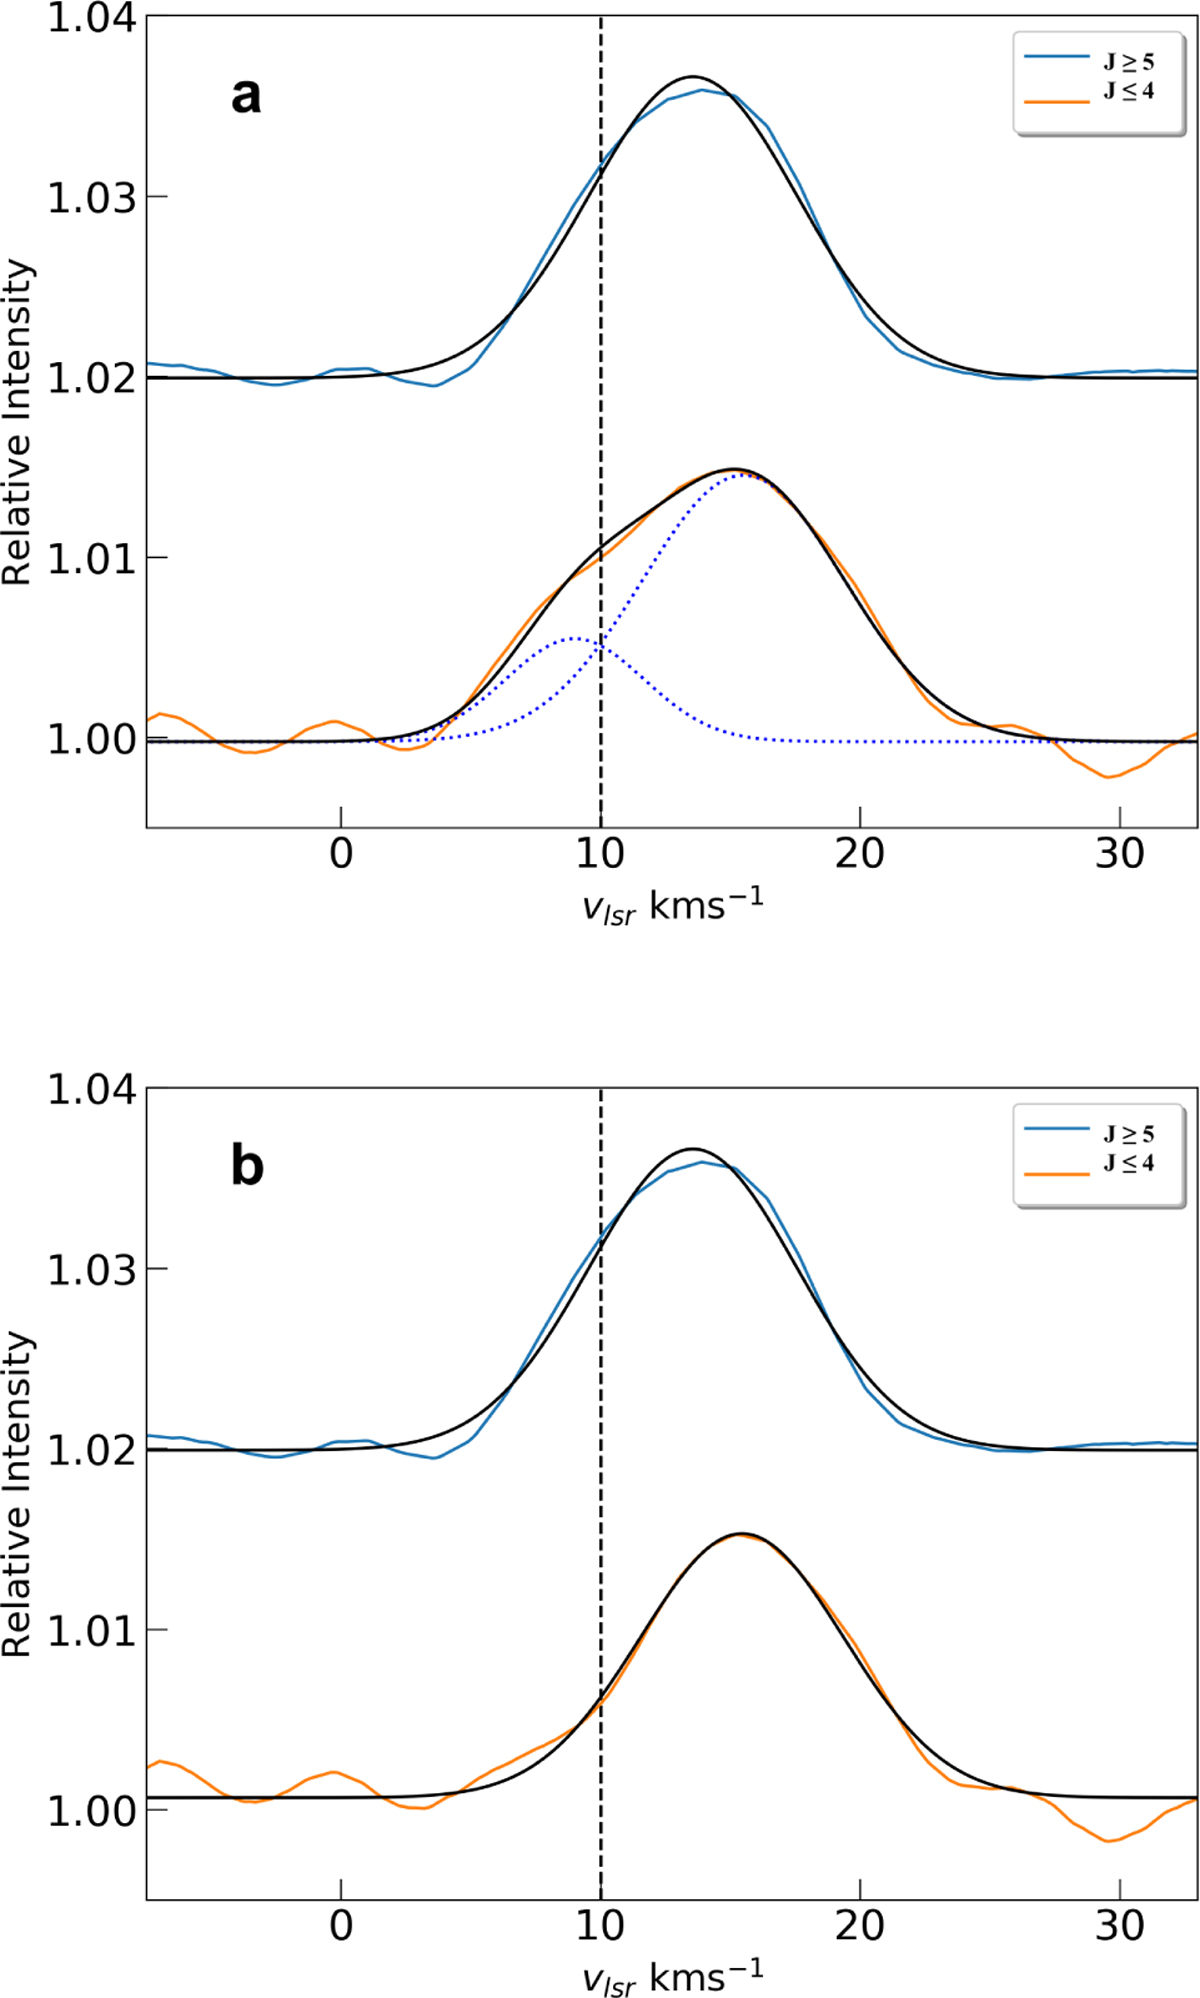
Line proflies created by averaging a selection of high quality low (bottom) and high-J (top) HCN lines toward MonR2 IRS 3A. J in this case is Jupper and the high energy lines are chosen as those with J ≥ 5, shown in blue, and the low energy lines are those with J ≤ 4, shown in orange. The vertical dashed line denotes the cloud velocity of 10 km s−1 (van der Tak et al. 2003). Panel a shows fits to the average line profiles given in black and individual contributions to the fit as blue dotted lines. Panel b shows fits to the average line profiles with the contribution at 9 km s−1 subtracted out.
Current usage metrics show cumulative count of Article Views (full-text article views including HTML views, PDF and ePub downloads, according to the available data) and Abstracts Views on Vision4Press platform.
Data correspond to usage on the plateform after 2015. The current usage metrics is available 48-96 hours after online publication and is updated daily on week days.
Initial download of the metrics may take a while.