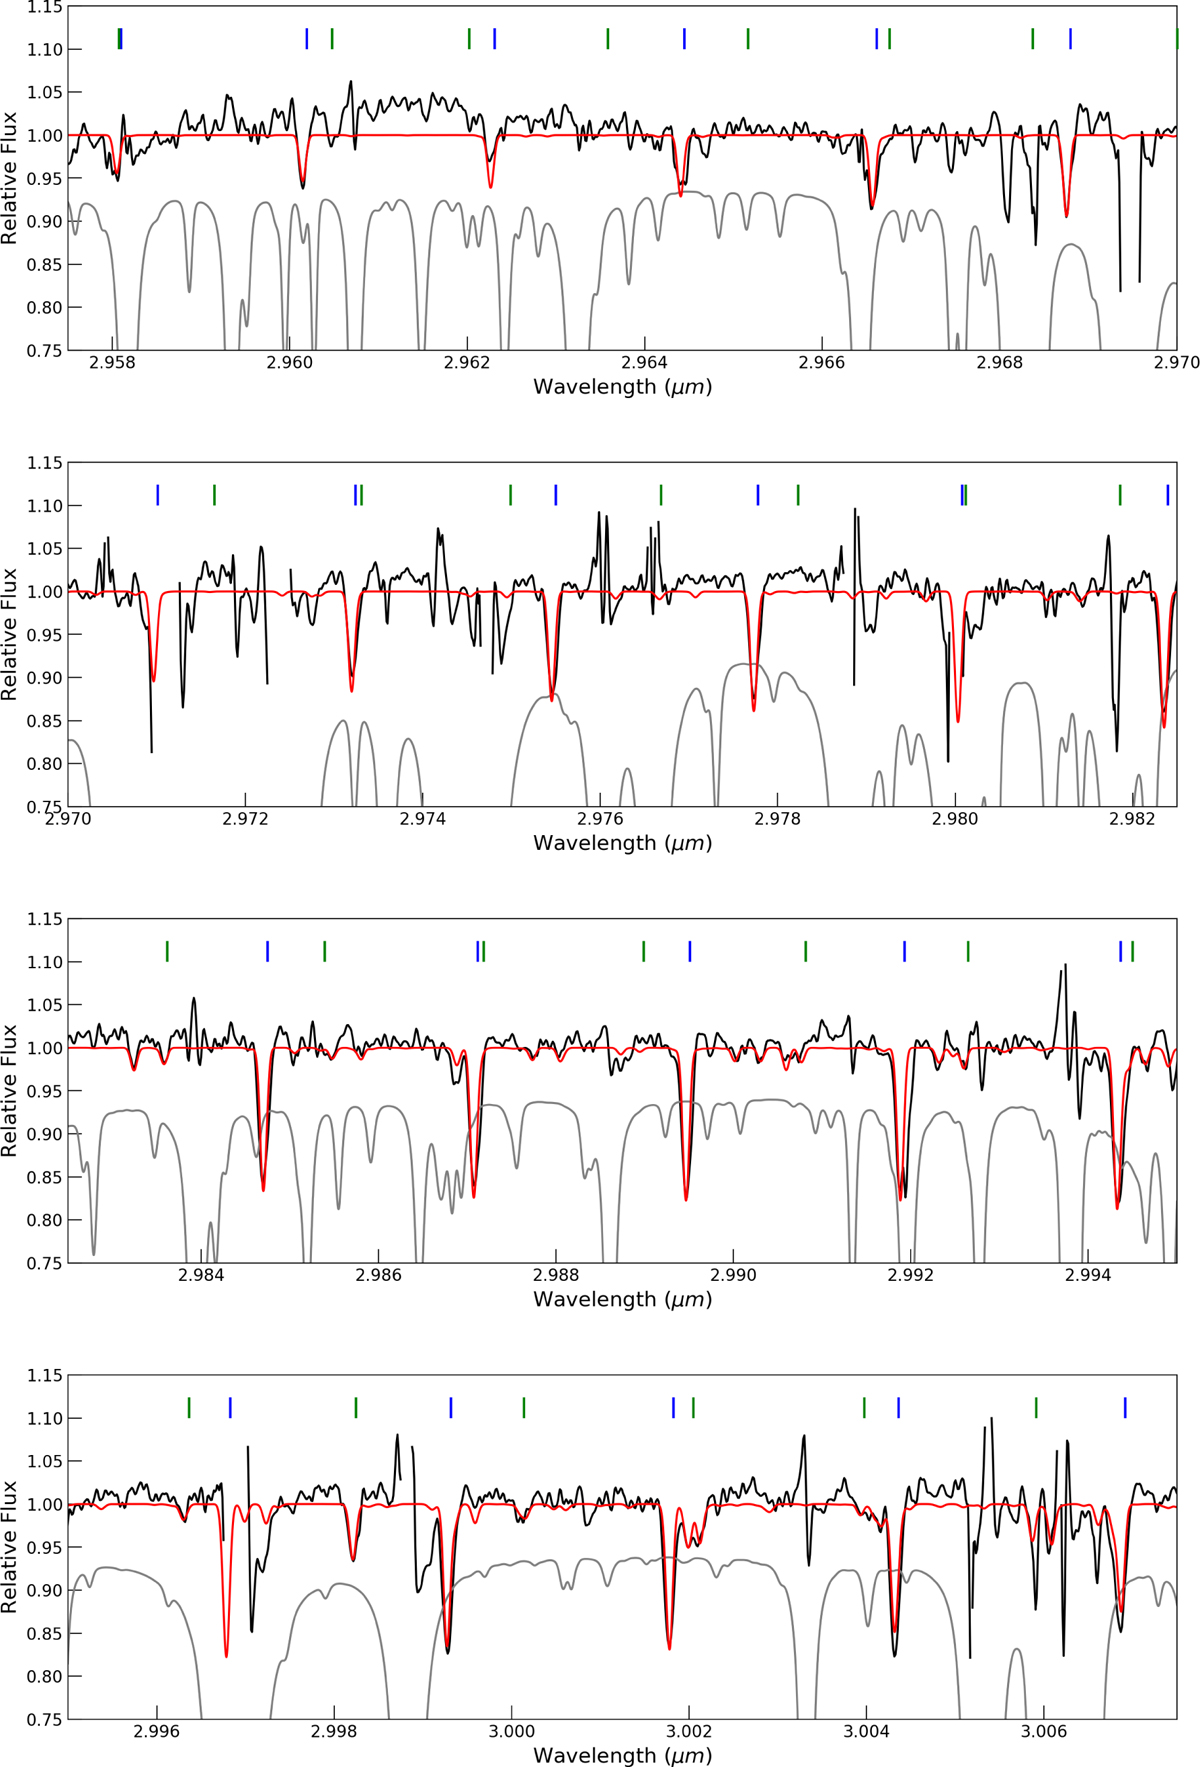
Fig. A.6
Download original image
L2 setting of AFGL 2136 in the range where absorption lines are present. In red is shown an LTE model of HCN at column density and temperature of 1 × 1017 cm−2 and 500 K respectively, and C2H2 at column density of 8 × 1016 cm−2 and 500 K respectively. The identifications of the HCN v1 band and C2H2 v2 + (v4 + v5) band are given as blue and green dashes respectively. The grey model is the atmospheric ATRAN model and regions of very bad transmission have been masked out of the science spectrum.
Current usage metrics show cumulative count of Article Views (full-text article views including HTML views, PDF and ePub downloads, according to the available data) and Abstracts Views on Vision4Press platform.
Data correspond to usage on the plateform after 2015. The current usage metrics is available 48-96 hours after online publication and is updated daily on week days.
Initial download of the metrics may take a while.