Open Access
Fig. A.1
Download original image
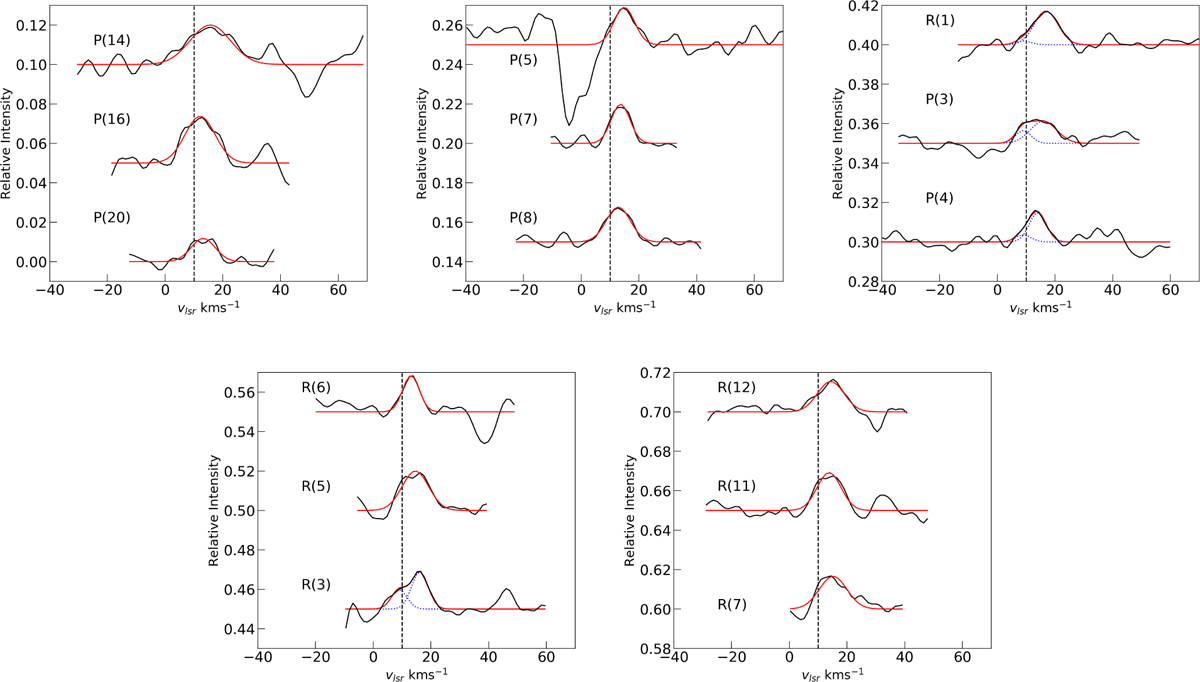
Line profiles of the detected transitions of the HCN v1 band of MonR2 IRS 3A. Fits are shown in red, including a two Gaussian composite fit for the P(4), P(3), R(3) and R(l) lines with individual contributions show as blue.
Current usage metrics show cumulative count of Article Views (full-text article views including HTML views, PDF and ePub downloads, according to the available data) and Abstracts Views on Vision4Press platform.
Data correspond to usage on the plateform after 2015. The current usage metrics is available 48-96 hours after online publication and is updated daily on week days.
Initial download of the metrics may take a while.