Fig. 11
Download original image
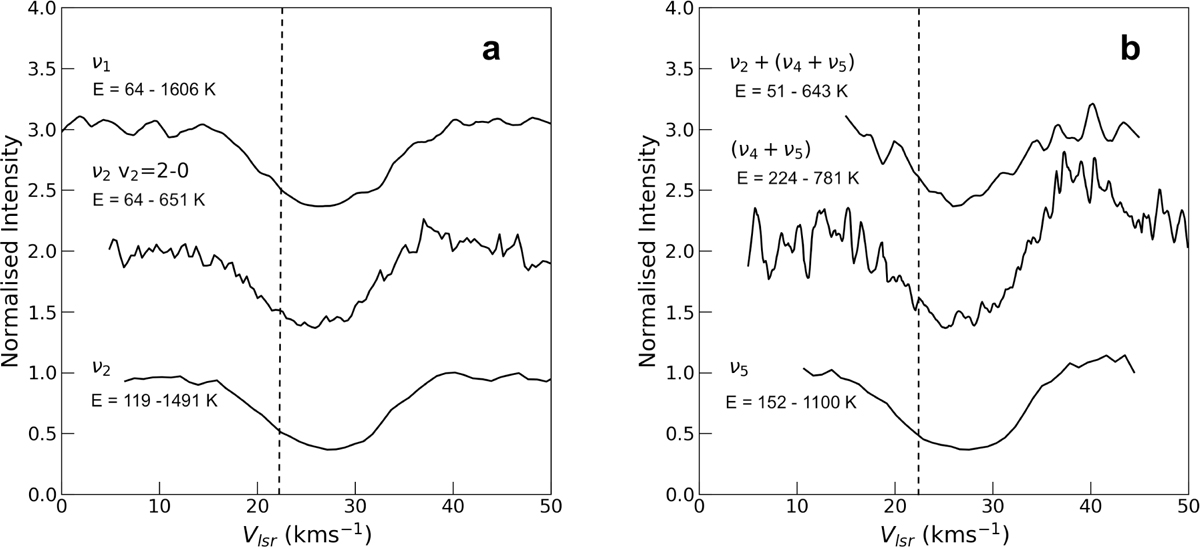
Average line profiles of the various bands of HCN (panel a) and C2H2 (panel b) detected in absorption towards AFGL 2136. The energy range over which the line profiles are averaged are given for each band. The dashed line represents the systemic velocity at 22 km s−1. The range of lower energy level E over which the average line profiles were calculated is shown for each band.
Current usage metrics show cumulative count of Article Views (full-text article views including HTML views, PDF and ePub downloads, according to the available data) and Abstracts Views on Vision4Press platform.
Data correspond to usage on the plateform after 2015. The current usage metrics is available 48-96 hours after online publication and is updated daily on week days.
Initial download of the metrics may take a while.