Fig. 9.
Download original image
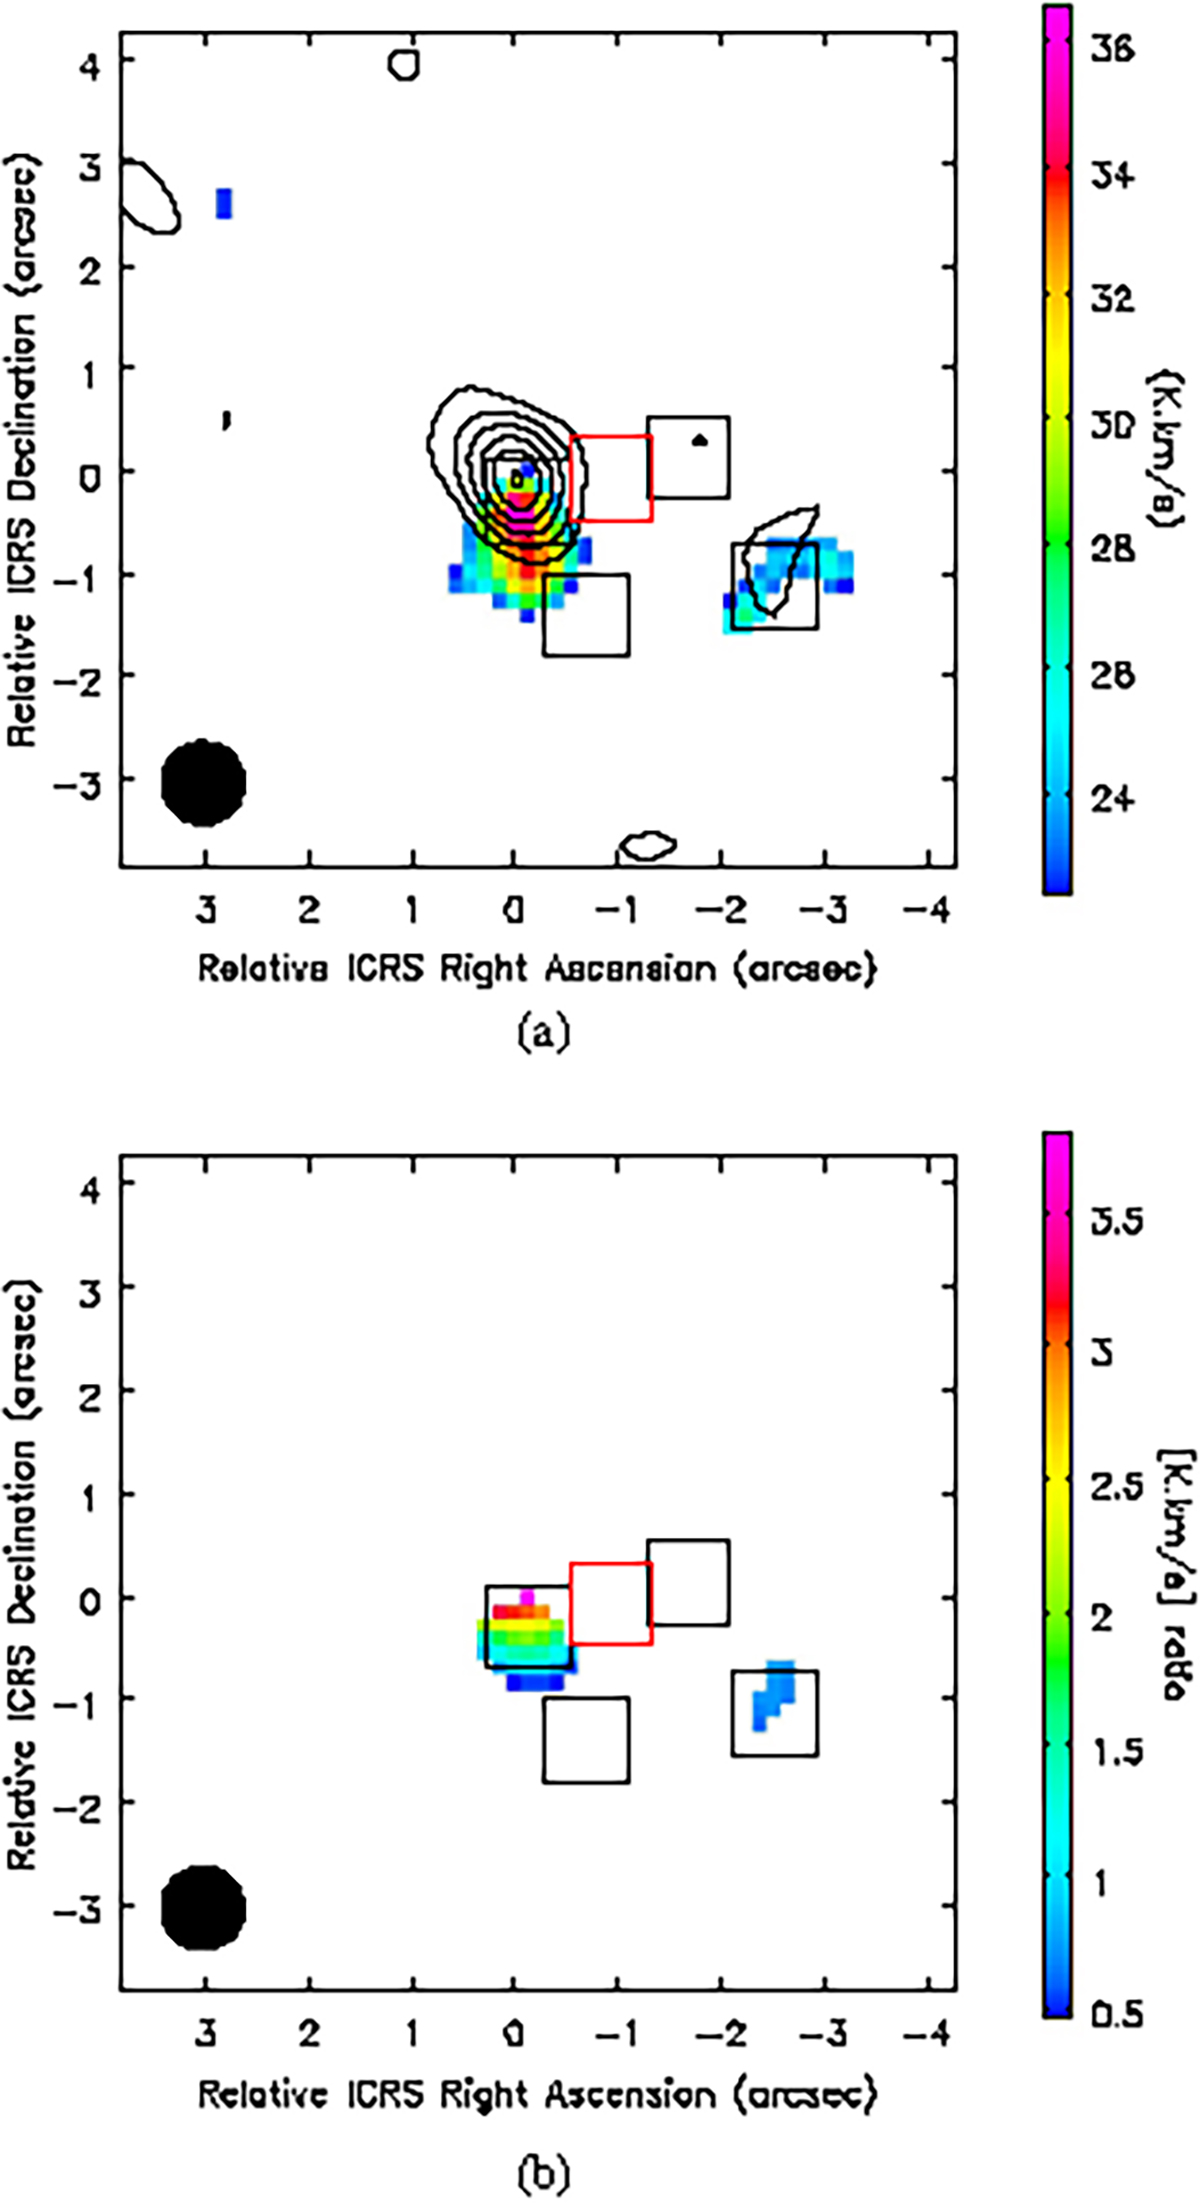
The comparison maps between SiO(3–2) and HNCO(5–4) in overlay and ratio maps. In the overlay (a) map the HNCO(5–4) is shown in color map, and SiO(3–2) in contours. The contour starts from 3.0σ, with step of 3.0σ. In (b) the SiO(3–2)/HNCO(5–4) ratio map is displayed. The black and red square boxes mark the ![]() regions listed in Table 2, where the AGN is marked in red. The contour starts from 3.0σ, with step of 3.0σ. These maps were pre-smoothed to the common resolution of
regions listed in Table 2, where the AGN is marked in red. The contour starts from 3.0σ, with step of 3.0σ. These maps were pre-smoothed to the common resolution of ![]() and masked by 3.0σ threshold.
and masked by 3.0σ threshold.
Current usage metrics show cumulative count of Article Views (full-text article views including HTML views, PDF and ePub downloads, according to the available data) and Abstracts Views on Vision4Press platform.
Data correspond to usage on the plateform after 2015. The current usage metrics is available 48-96 hours after online publication and is updated daily on week days.
Initial download of the metrics may take a while.