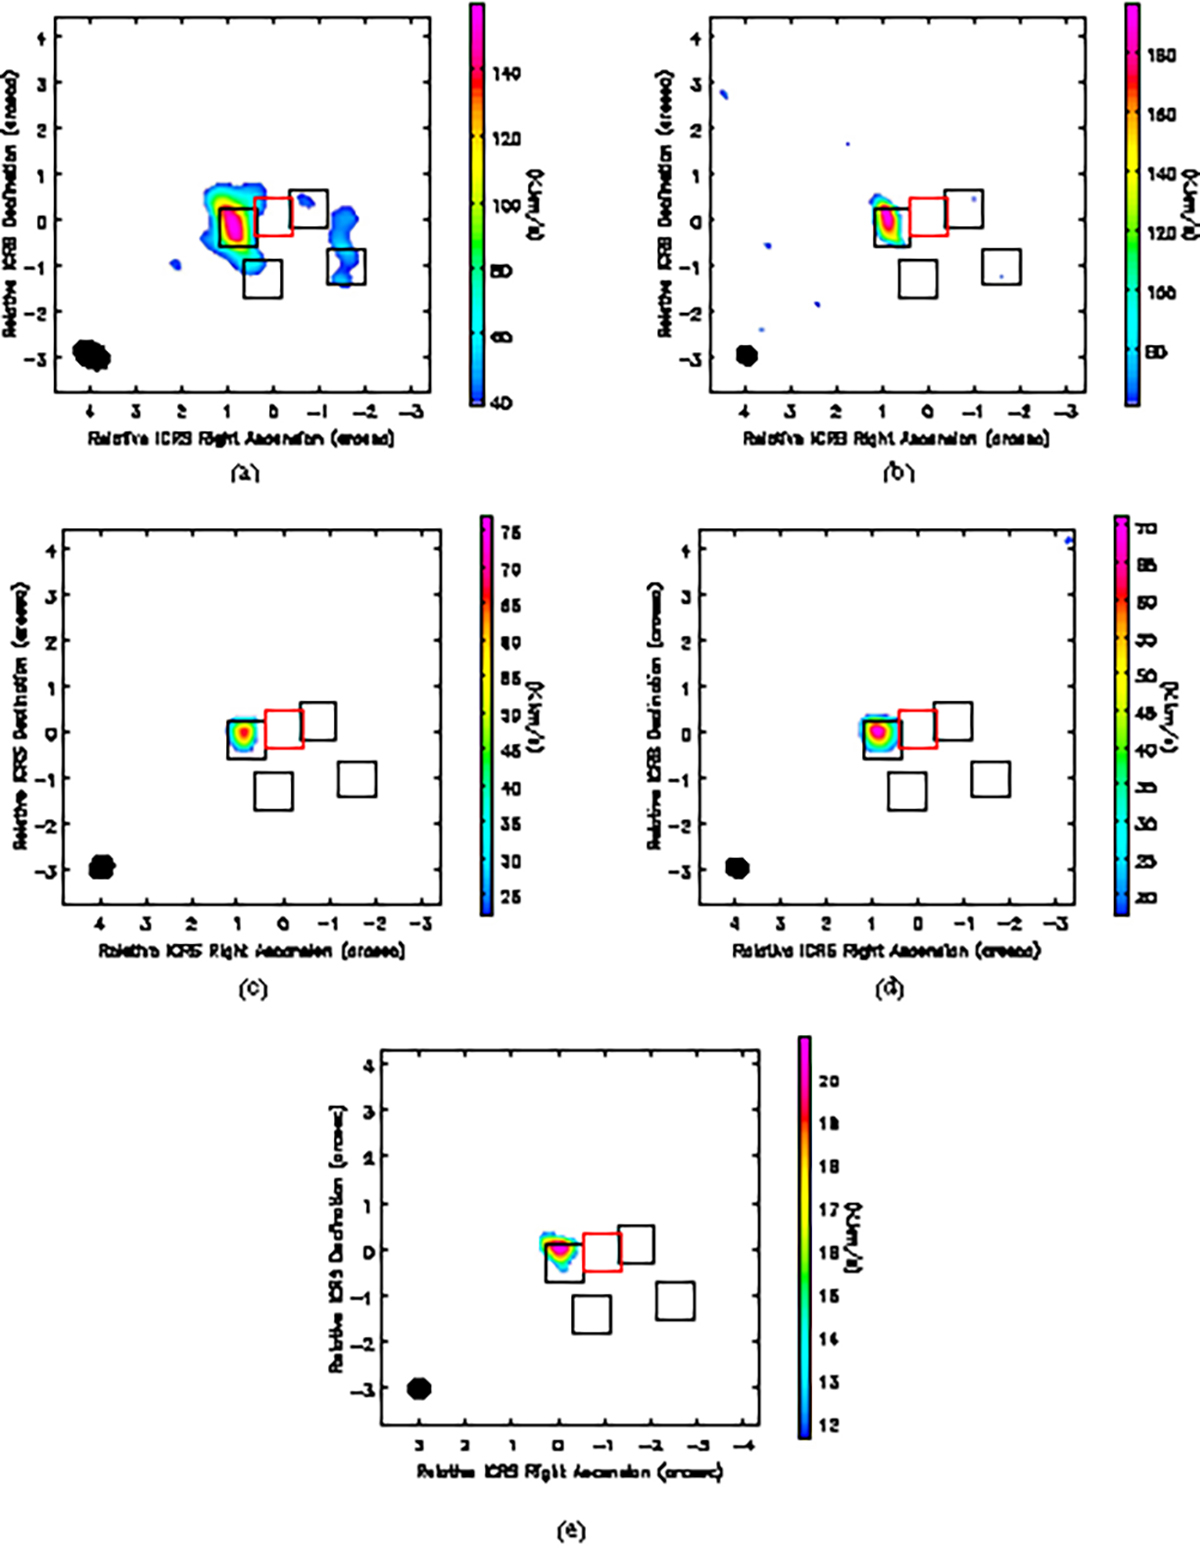
Fig. 7.
Download original image
The velocity-integrated intensity maps of (a) SiO(2–1), (b) SiO(3–2), (c) SiO(5–4), (d) SiO(6–5), (e) SiO(7–6) at their original spatial resolution. This is zoomed-in at the CND scale. The black and red boxes mark the regions listed in Table 2, where the AGN is marked with the red box. These maps are masked with a 3.0σ threshold after the integration over velocity. The velocity ranges for integration are: SiO(2–1) with [−230 km s−1, 160 km s−1], SiO(6–5) with [−230 km s−1, 151 km s−1], and SiO(7–6) with [−74 km s−1, 230 km s−1], and for the rest is the default [−230 km s−1, 230 km s−1].
Current usage metrics show cumulative count of Article Views (full-text article views including HTML views, PDF and ePub downloads, according to the available data) and Abstracts Views on Vision4Press platform.
Data correspond to usage on the plateform after 2015. The current usage metrics is available 48-96 hours after online publication and is updated daily on week days.
Initial download of the metrics may take a while.