Fig. 4.
Download original image
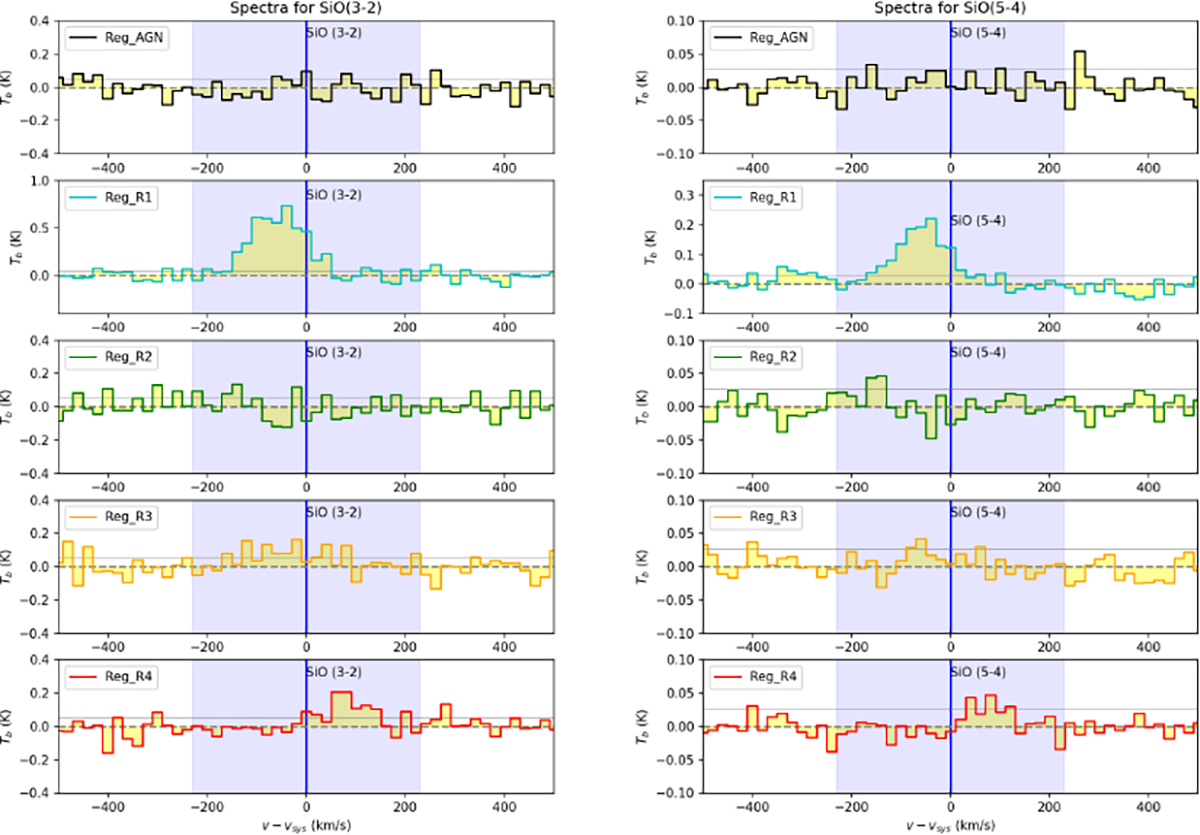
Spectra of the SiO (3–2) and SiO(5–4) transitions. Each color-coded solid curve plots the spectral data from each selected ![]() region listed in Table 2 from the data cube at their original spectral resolution. The spectral resolution of these lines are: 20.1 km s−1 for SiO (3–2) and (5–4). The solid blue vertical lines are the SiO lines, the rest dashed blue vertical lines are bonus lines potentially covered by our spectral setup. Velocities refer to vsys, LSRK = 1120 km s−1. The blue shaded area indicates the velocity coverage we use to derive the velocity-integrated line intensities in our analysis at later stage. The grey solid horizontal line refers to the 1σ level for each transition.
region listed in Table 2 from the data cube at their original spectral resolution. The spectral resolution of these lines are: 20.1 km s−1 for SiO (3–2) and (5–4). The solid blue vertical lines are the SiO lines, the rest dashed blue vertical lines are bonus lines potentially covered by our spectral setup. Velocities refer to vsys, LSRK = 1120 km s−1. The blue shaded area indicates the velocity coverage we use to derive the velocity-integrated line intensities in our analysis at later stage. The grey solid horizontal line refers to the 1σ level for each transition.
Current usage metrics show cumulative count of Article Views (full-text article views including HTML views, PDF and ePub downloads, according to the available data) and Abstracts Views on Vision4Press platform.
Data correspond to usage on the plateform after 2015. The current usage metrics is available 48-96 hours after online publication and is updated daily on week days.
Initial download of the metrics may take a while.