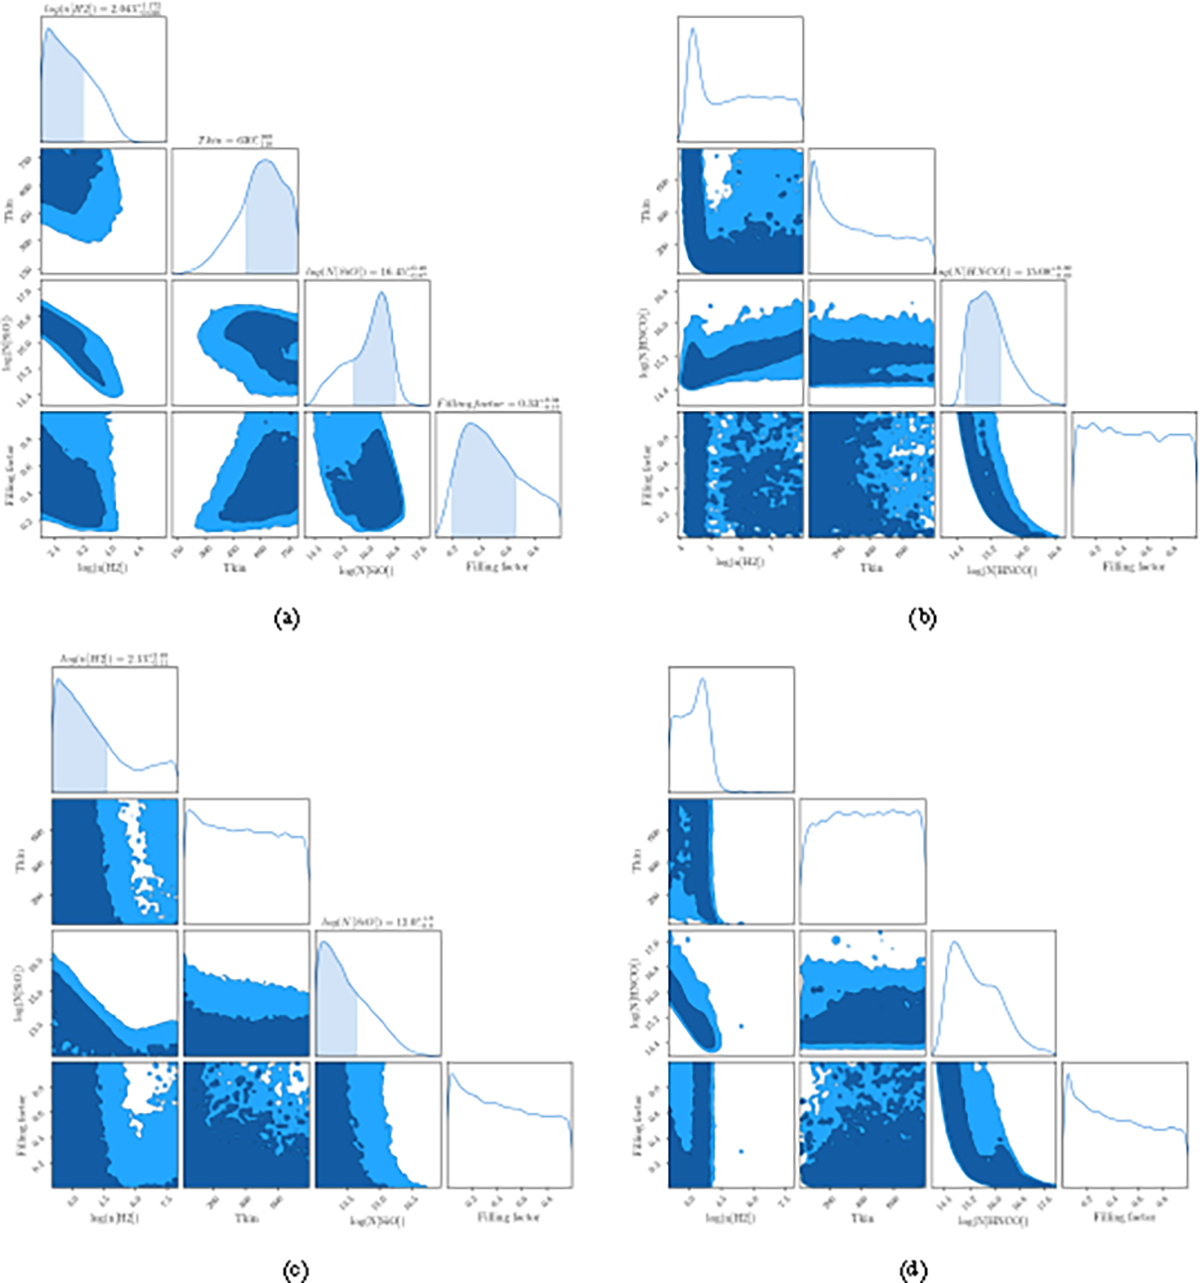
Fig. B.1.
Download original image
Corner plots which shows the sampled distributions for each parameter, as displayed on the x-axis. The 1D distributions on the diagonal are the posterior distributions for each explored parameter, the reset 2D distributions are the joint posterior for corresponding parameter pair on the x- and y- axes. In the 1D distributions, the 1σ regions are shaded with blue; both 1σ and 2σ are shaded in the 2D distributions. On top of each 1D distribution listed the inferred values if the distribution can be properly constrained. Results from CND-R1 and CND-R2 are presented: (a)SiO in CND-R1, (b) HNCO in CND-R1, (c)SiO in CND-R2, (d) HNCO in CND-R2
Current usage metrics show cumulative count of Article Views (full-text article views including HTML views, PDF and ePub downloads, according to the available data) and Abstracts Views on Vision4Press platform.
Data correspond to usage on the plateform after 2015. The current usage metrics is available 48-96 hours after online publication and is updated daily on week days.
Initial download of the metrics may take a while.