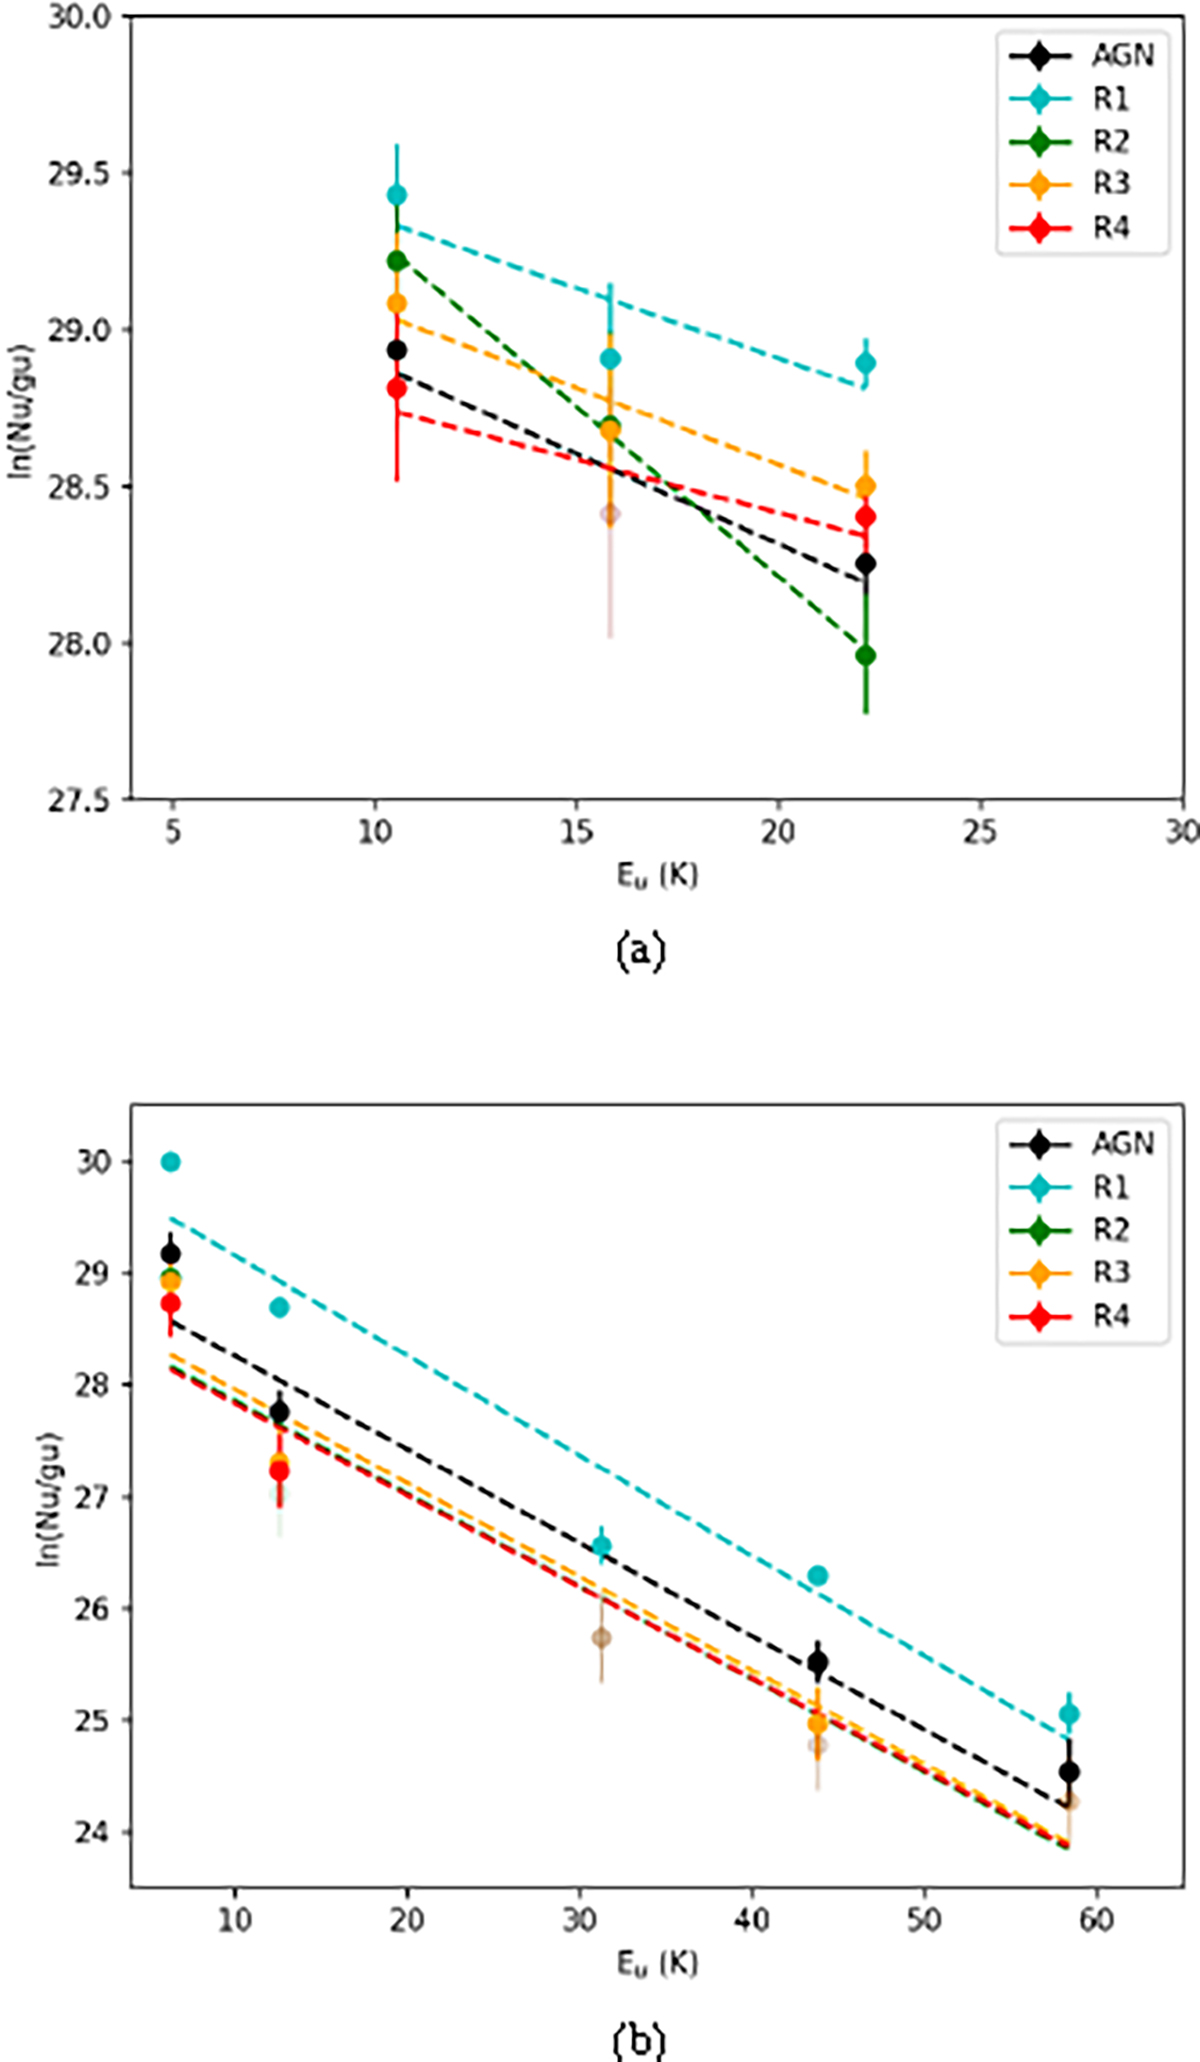
Fig. 11.
Download original image
The rotation diagram derived from (a) HNCO transitions and (b) SiO transitions in all selected regions. The uncertainty is propagated from the measured error from the line intensity. The color coding indicates data from each region selected as shown in the schematic in Fig. 6d. The faded (gray-ish) marks indicate data points below 3.0σ cut, to which case we will use 3.0σ as upper limit in our further analysis. The fitted rotational temperature are list in Table A.1.
Current usage metrics show cumulative count of Article Views (full-text article views including HTML views, PDF and ePub downloads, according to the available data) and Abstracts Views on Vision4Press platform.
Data correspond to usage on the plateform after 2015. The current usage metrics is available 48-96 hours after online publication and is updated daily on week days.
Initial download of the metrics may take a while.