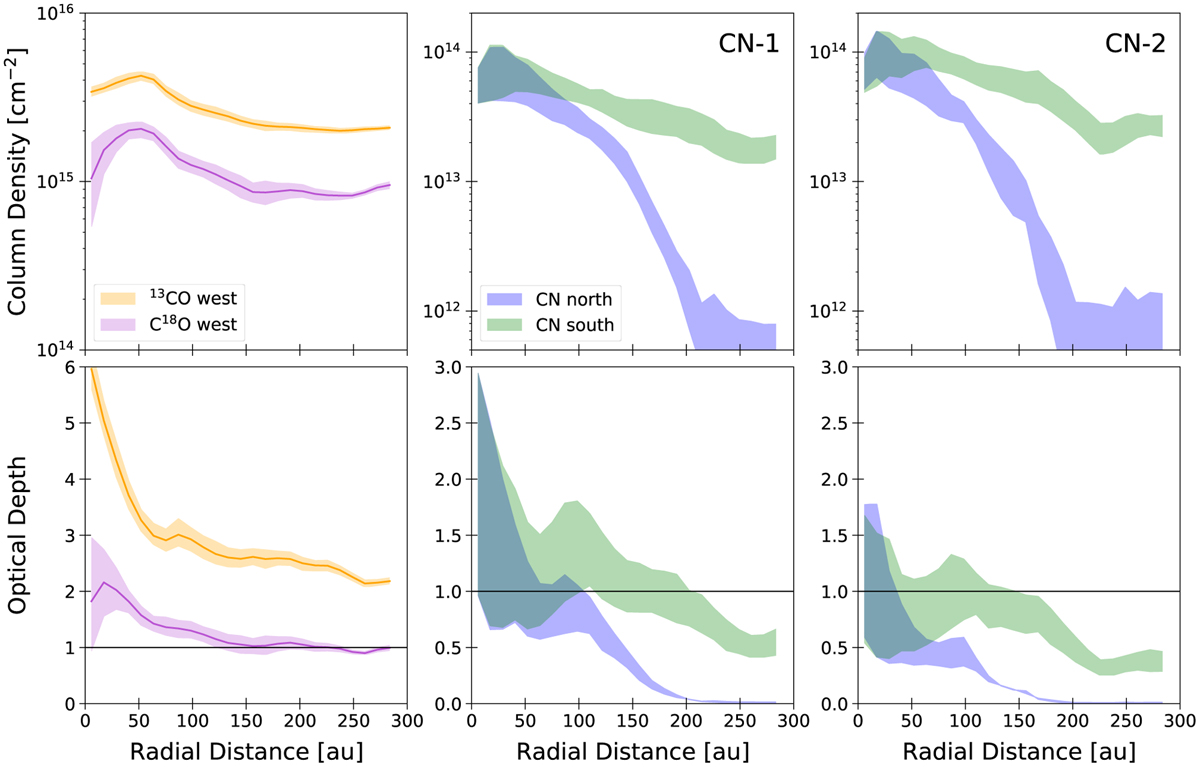
Fig. 10
Download original image
Azimuthally averaged emission properties for CO isotopologs and CN. Top row: column density profiles for each analyzed tracer. Shown together in the leftmost panel are 13CO and C18O. Middle and right panels: column density profile of each CN hyperfine group, separated between north and south sides of the disk. Bottom row: Optical depth profile for each molecule, following the same order as the top row. The horizontal black lines indicate the optical depth of τ = 1. In all panels, the shaded regions show the uncertainty on the model.
Current usage metrics show cumulative count of Article Views (full-text article views including HTML views, PDF and ePub downloads, according to the available data) and Abstracts Views on Vision4Press platform.
Data correspond to usage on the plateform after 2015. The current usage metrics is available 48-96 hours after online publication and is updated daily on week days.
Initial download of the metrics may take a while.