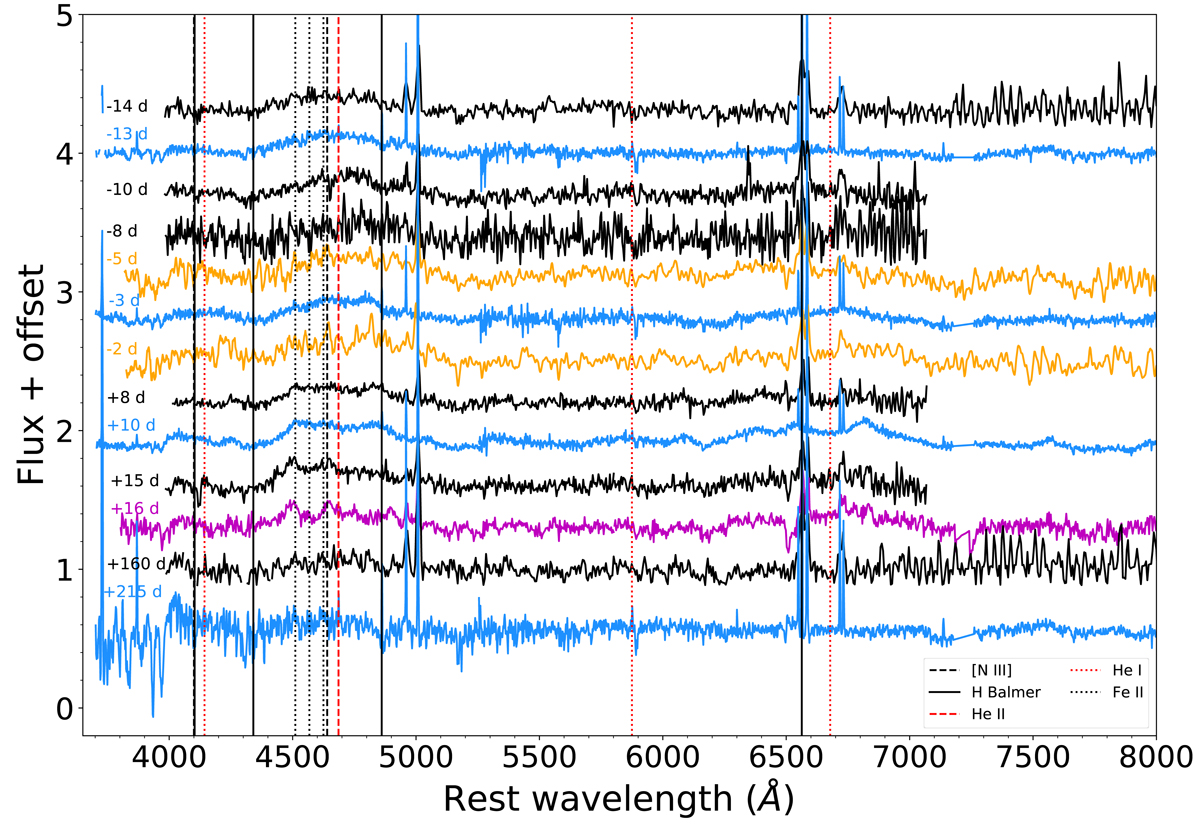
Fig. 9.
Download original image
Spectral evolution of AT 2020zso from early to late times. All spectra are continuum normalised. The different emission features in the 4600 Å blend are indicated with vertical lines: solid black lines indicate H Balmer lines, dashed black lines N III, dotted black lines Fe II, red dashed lines He II, and red dotted lines He I. Black spectra were taken with NTT/EFOSC2, blue with VLTX-shooter, orange with LCO/FLOYDS, and magenta with NOT/ALFOSC. The X-shooter spectra are resampled at lower spectral resolution for clarity. The gap around 5200 Å is due to the low S/N of the data at the edges of the UVB and VIS arms, and the gap around 7300 Å is due to the poor correction of molecular bands.
Current usage metrics show cumulative count of Article Views (full-text article views including HTML views, PDF and ePub downloads, according to the available data) and Abstracts Views on Vision4Press platform.
Data correspond to usage on the plateform after 2015. The current usage metrics is available 48-96 hours after online publication and is updated daily on week days.
Initial download of the metrics may take a while.