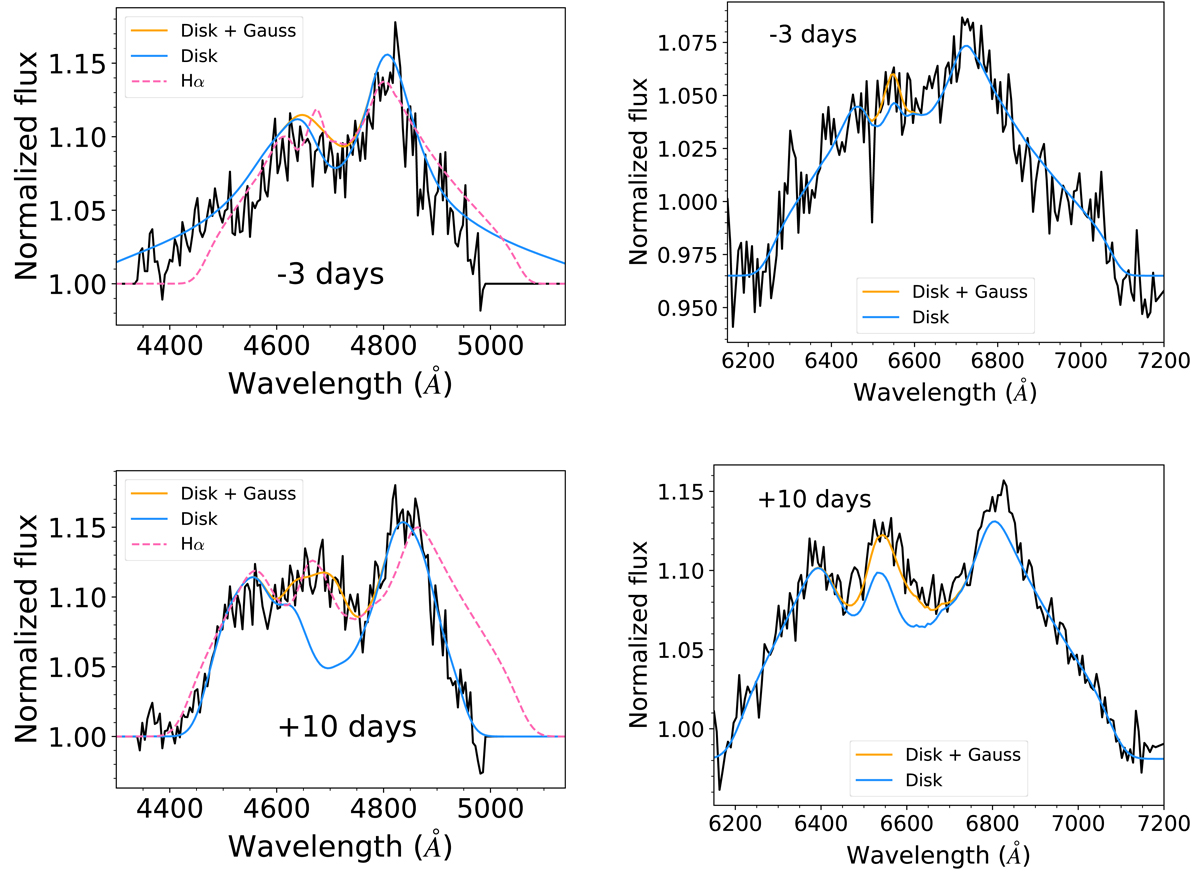
Fig. 14.
Download original image
Best-fit accretion disk plus Gaussian models, overlaid on the emission line profiles of He II (left panels) and Hα (right panels). Black represents the data, blue the accretion disk model, and orange the accretion disk plus outflow model. The best-fit Hα models are overplotted in the He II profiles as dashed lines for comparison. The red wing of He II is poorly subtracted, leading to some differences with the Hα profiles, but overall the results are consistent. The model parameters can be found in Table 5.
Current usage metrics show cumulative count of Article Views (full-text article views including HTML views, PDF and ePub downloads, according to the available data) and Abstracts Views on Vision4Press platform.
Data correspond to usage on the plateform after 2015. The current usage metrics is available 48-96 hours after online publication and is updated daily on week days.
Initial download of the metrics may take a while.