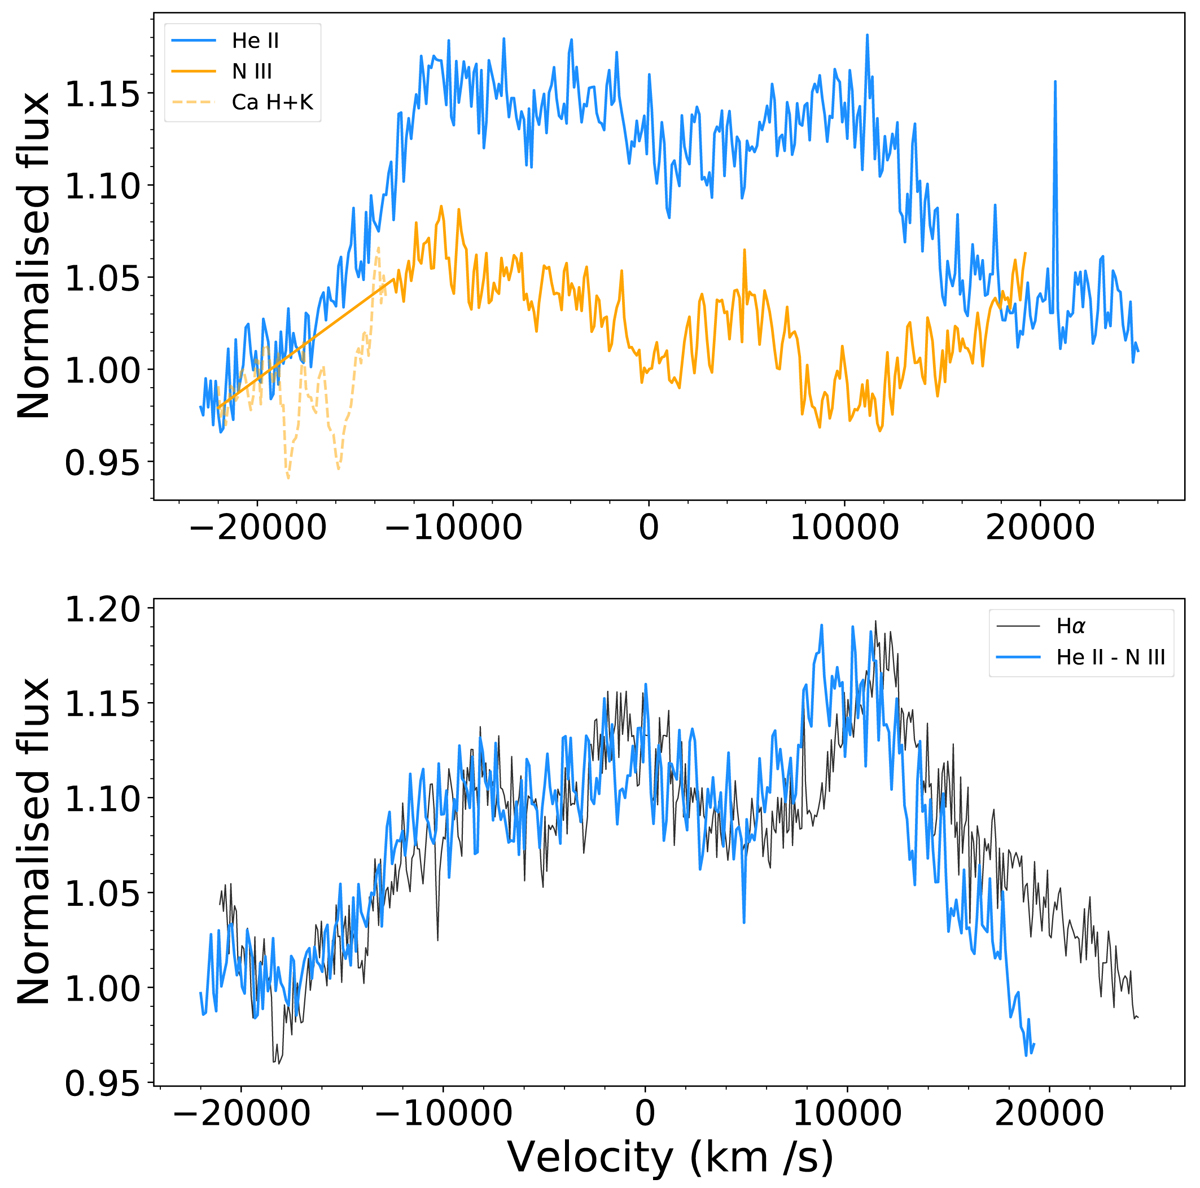
Fig. 13.
Download original image
Comparison of the emission line profiles. Top panel: He II (blue) and N III 4100 Å lines from the X-shooter spectrum at +10 days. Bottom panel: subtracted spectrum (He II – N III, blue) and Hα for comparison (in black). The line profiles are nearly identical, suggesting the presence of double-peaked Bowen N III lines, the first such line profiles seen in a TDE to date. The discrepancy in the red wing (compared to Hα) is likely related to the imperfect normalisation and subtraction of the N III profile.
Current usage metrics show cumulative count of Article Views (full-text article views including HTML views, PDF and ePub downloads, according to the available data) and Abstracts Views on Vision4Press platform.
Data correspond to usage on the plateform after 2015. The current usage metrics is available 48-96 hours after online publication and is updated daily on week days.
Initial download of the metrics may take a while.