Open Access
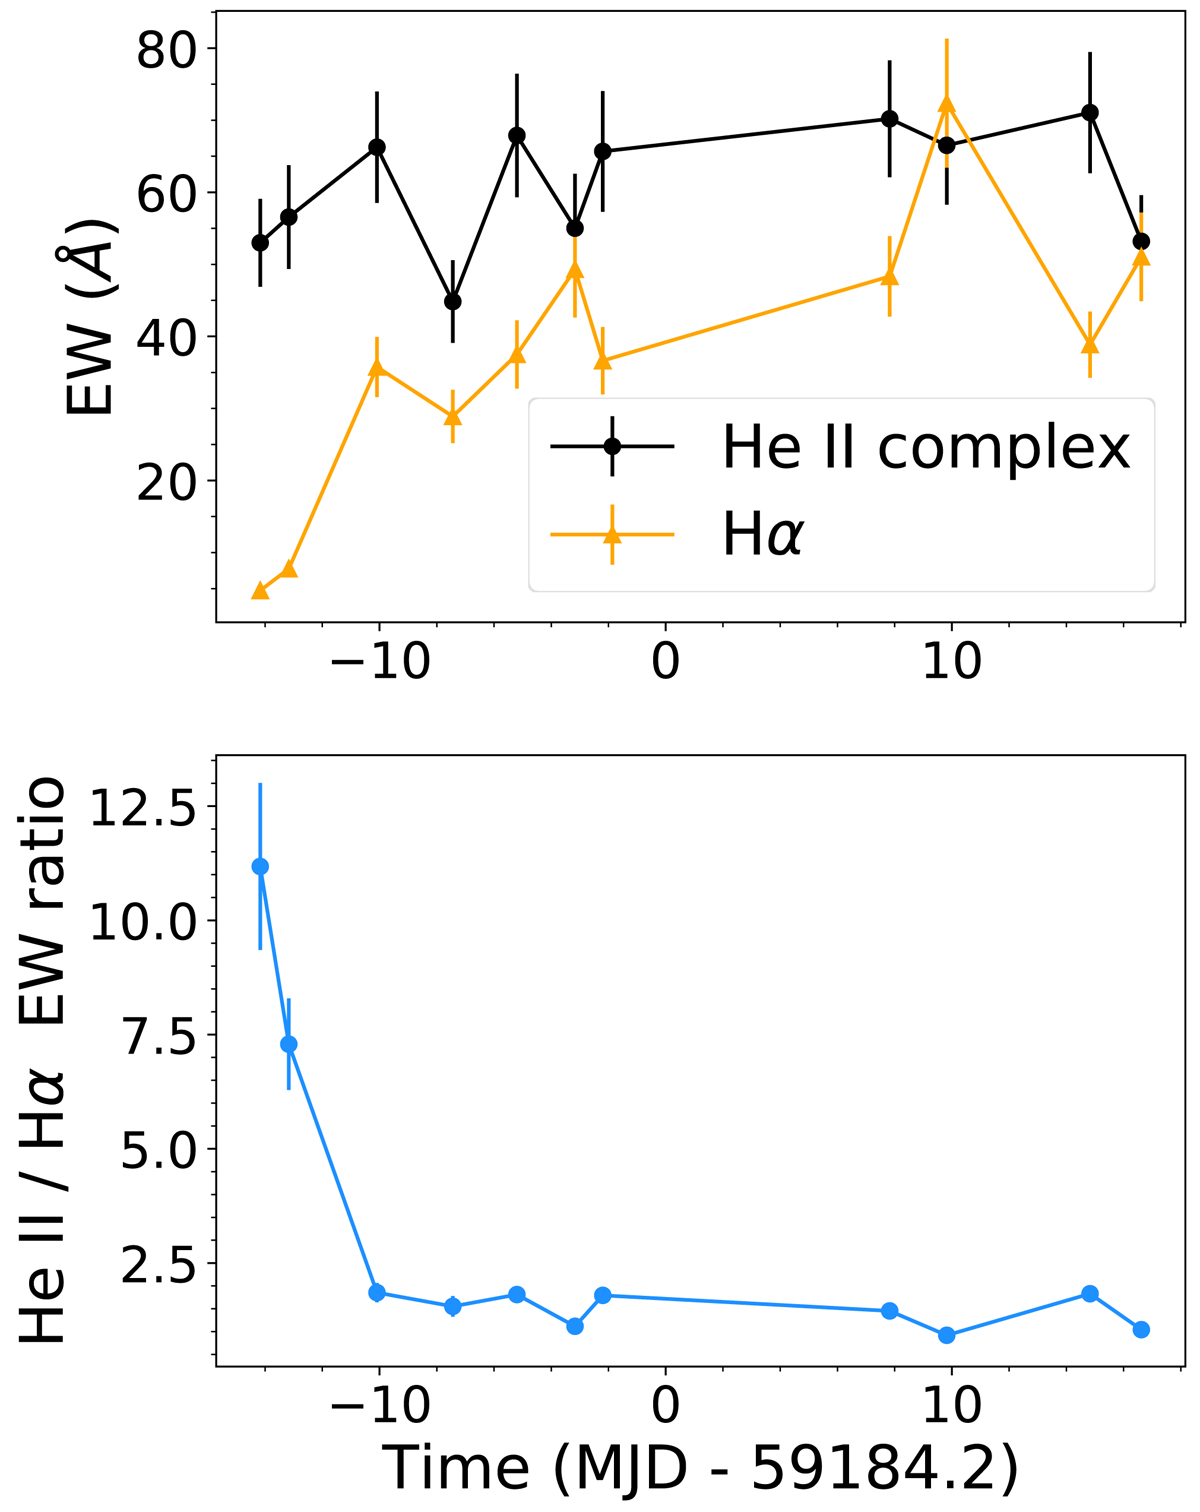
Fig. 12.
Download original image
Emission line measurements and their evolution over time. Top panel: equivalent width of the He II complex (black circles) and Hα (orange triangles), measured through direct integration from the spectra. Bottom: their ratio (He II/Hα) as a function of time.
Current usage metrics show cumulative count of Article Views (full-text article views including HTML views, PDF and ePub downloads, according to the available data) and Abstracts Views on Vision4Press platform.
Data correspond to usage on the plateform after 2015. The current usage metrics is available 48-96 hours after online publication and is updated daily on week days.
Initial download of the metrics may take a while.