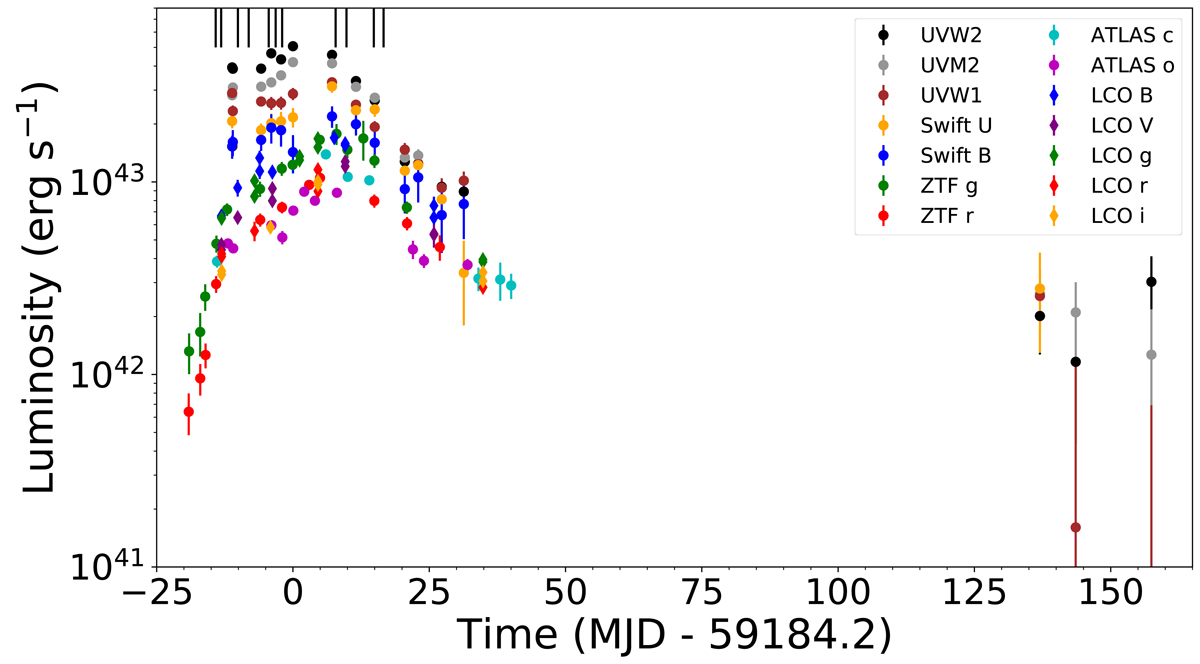
Fig. 1.
Download original image
Host-subtracted light curves of AT 2020zso as observed by Swift, ZTF, ATLAS, and LCO. Vertical lines indicate epochs of spectroscopic observations. As a result of colour evolution, the peak in the optical bands occurs significantly later than in the UV bands. This is consistent with the observed cooling of the blackbody temperature over time.
Current usage metrics show cumulative count of Article Views (full-text article views including HTML views, PDF and ePub downloads, according to the available data) and Abstracts Views on Vision4Press platform.
Data correspond to usage on the plateform after 2015. The current usage metrics is available 48-96 hours after online publication and is updated daily on week days.
Initial download of the metrics may take a while.