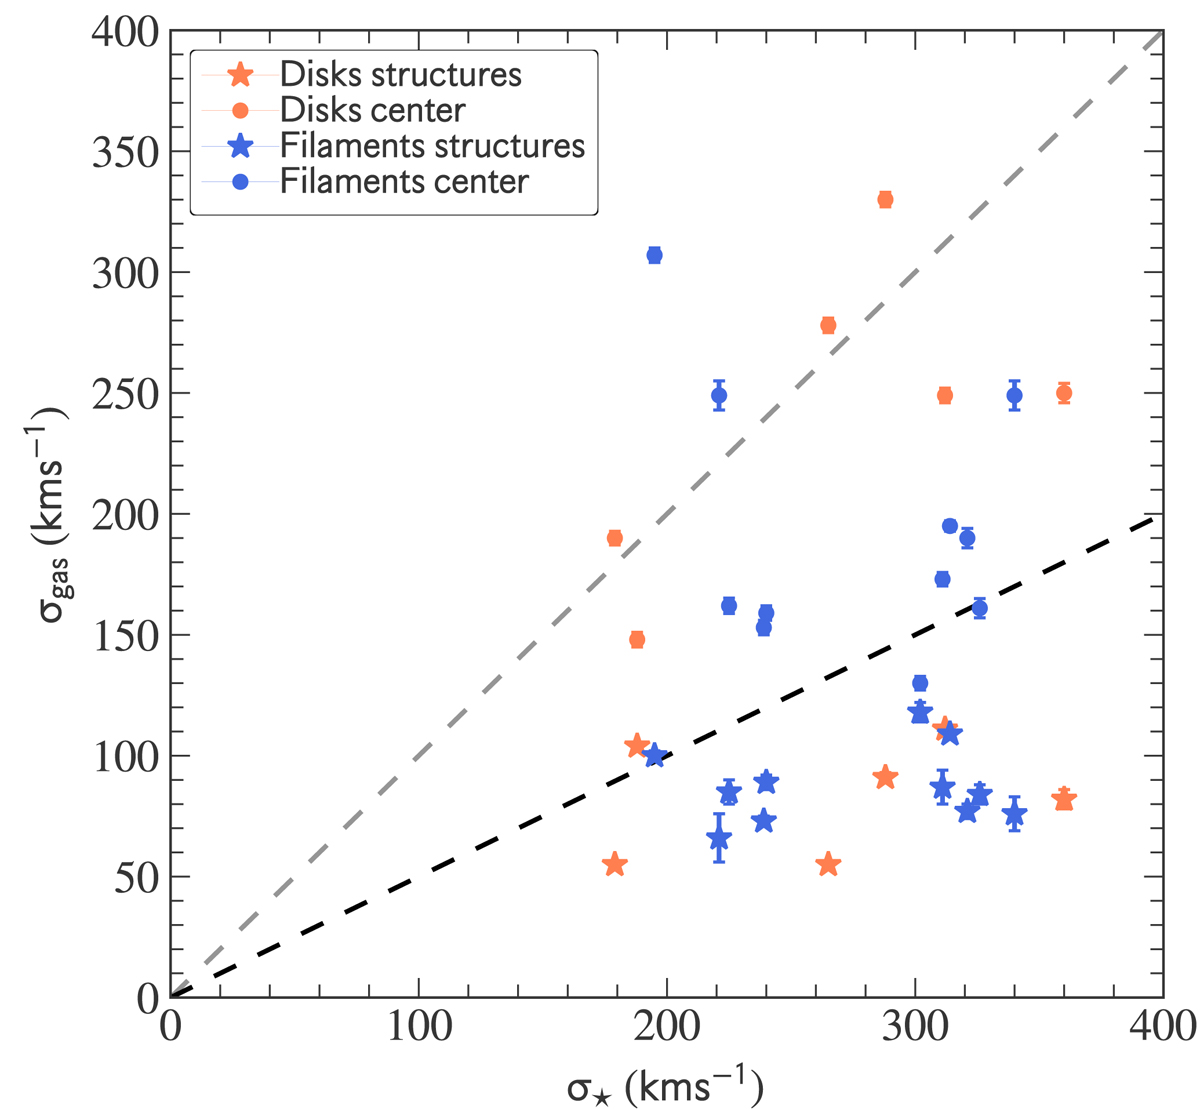
Fig. 5.
Download original image
The stellar velocity dispersion of the central group galaxy versus the optical emission line widths from the MUSE sample. The central velocity dispersion of the ionized gas is shown with circles, while the different structures, such as filaments, clumps, rings, and off-central regions, are shown with stars. The gray dashed line represents the one-to-one relation, while the black dashed line corresponds to half of the stellar velocity dispersion. Filaments and rotating disks are color-coded with blue and orange color symbols, respectively.
Current usage metrics show cumulative count of Article Views (full-text article views including HTML views, PDF and ePub downloads, according to the available data) and Abstracts Views on Vision4Press platform.
Data correspond to usage on the plateform after 2015. The current usage metrics is available 48-96 hours after online publication and is updated daily on week days.
Initial download of the metrics may take a while.