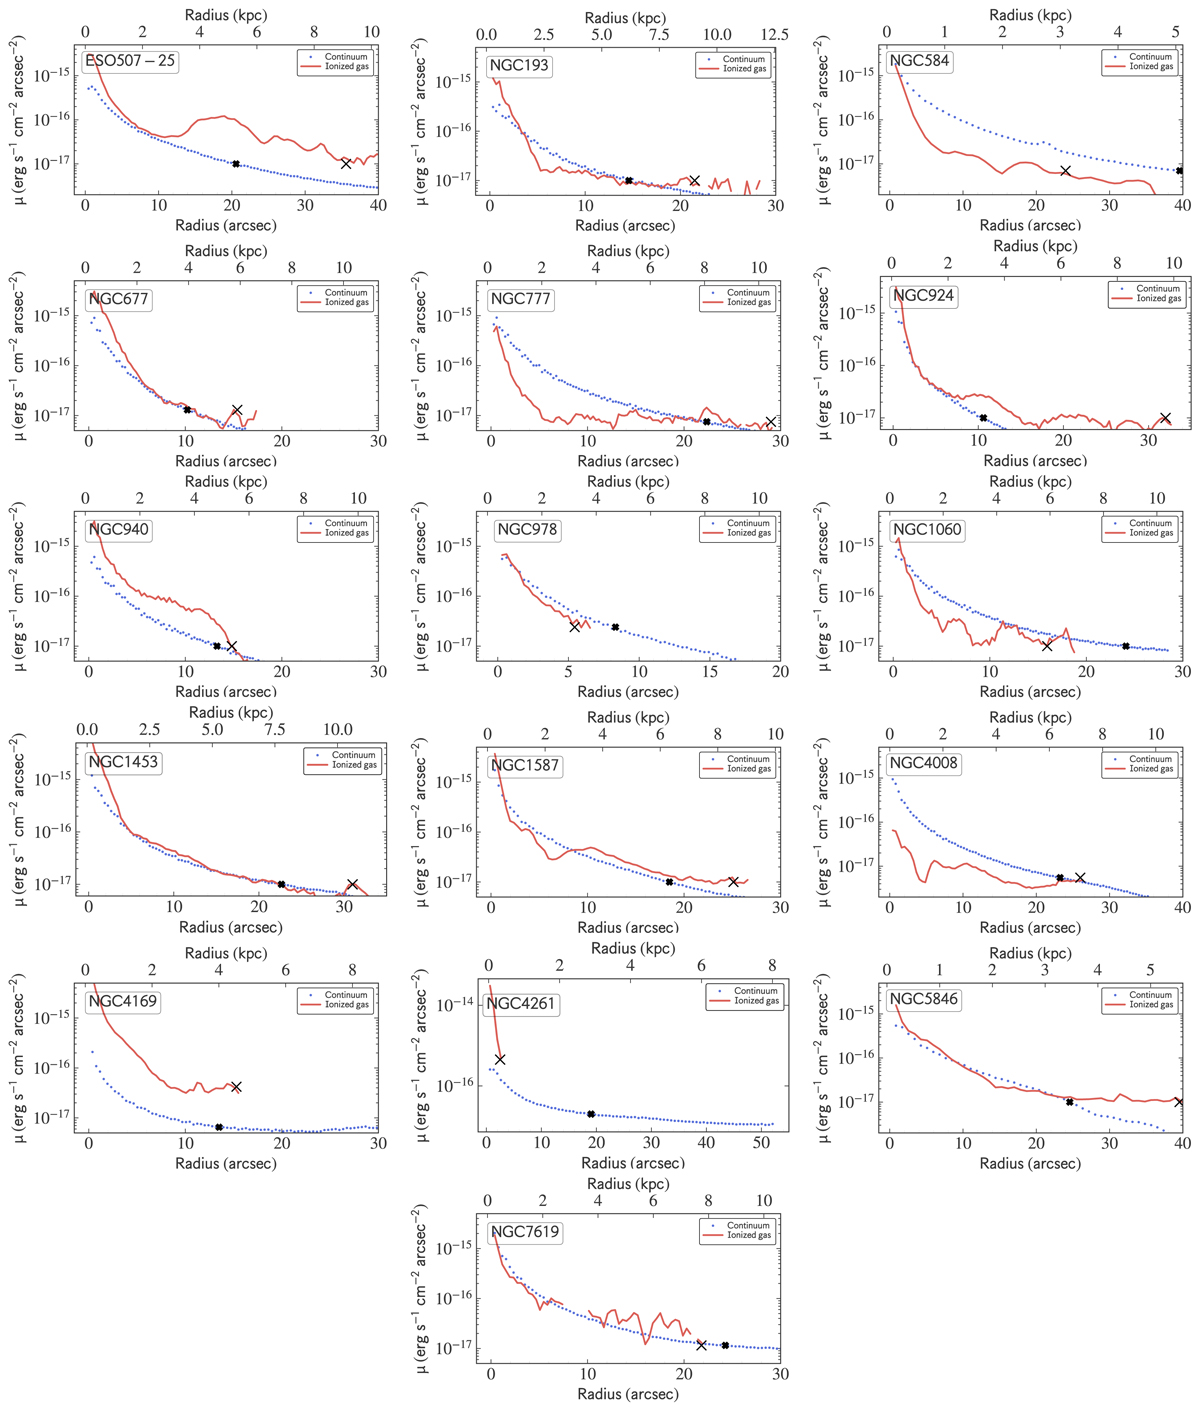
Fig. C.1.
Download original image
Surface brightness profiles of the continuum (blue dots) and [NII] emission line (red line). The black crosses correspond to the location where we measured the projected radius of the ionized gas and the continuum roughly at ∼ 10−17 erg s−1 cm−2 arcsec−2. No optical emitting gas is found at ∼ 10−17 erg s−1 cm−2 arcsec−2 for NGC 4169 and NGC 4261.
Current usage metrics show cumulative count of Article Views (full-text article views including HTML views, PDF and ePub downloads, according to the available data) and Abstracts Views on Vision4Press platform.
Data correspond to usage on the plateform after 2015. The current usage metrics is available 48-96 hours after online publication and is updated daily on week days.
Initial download of the metrics may take a while.