Open Access
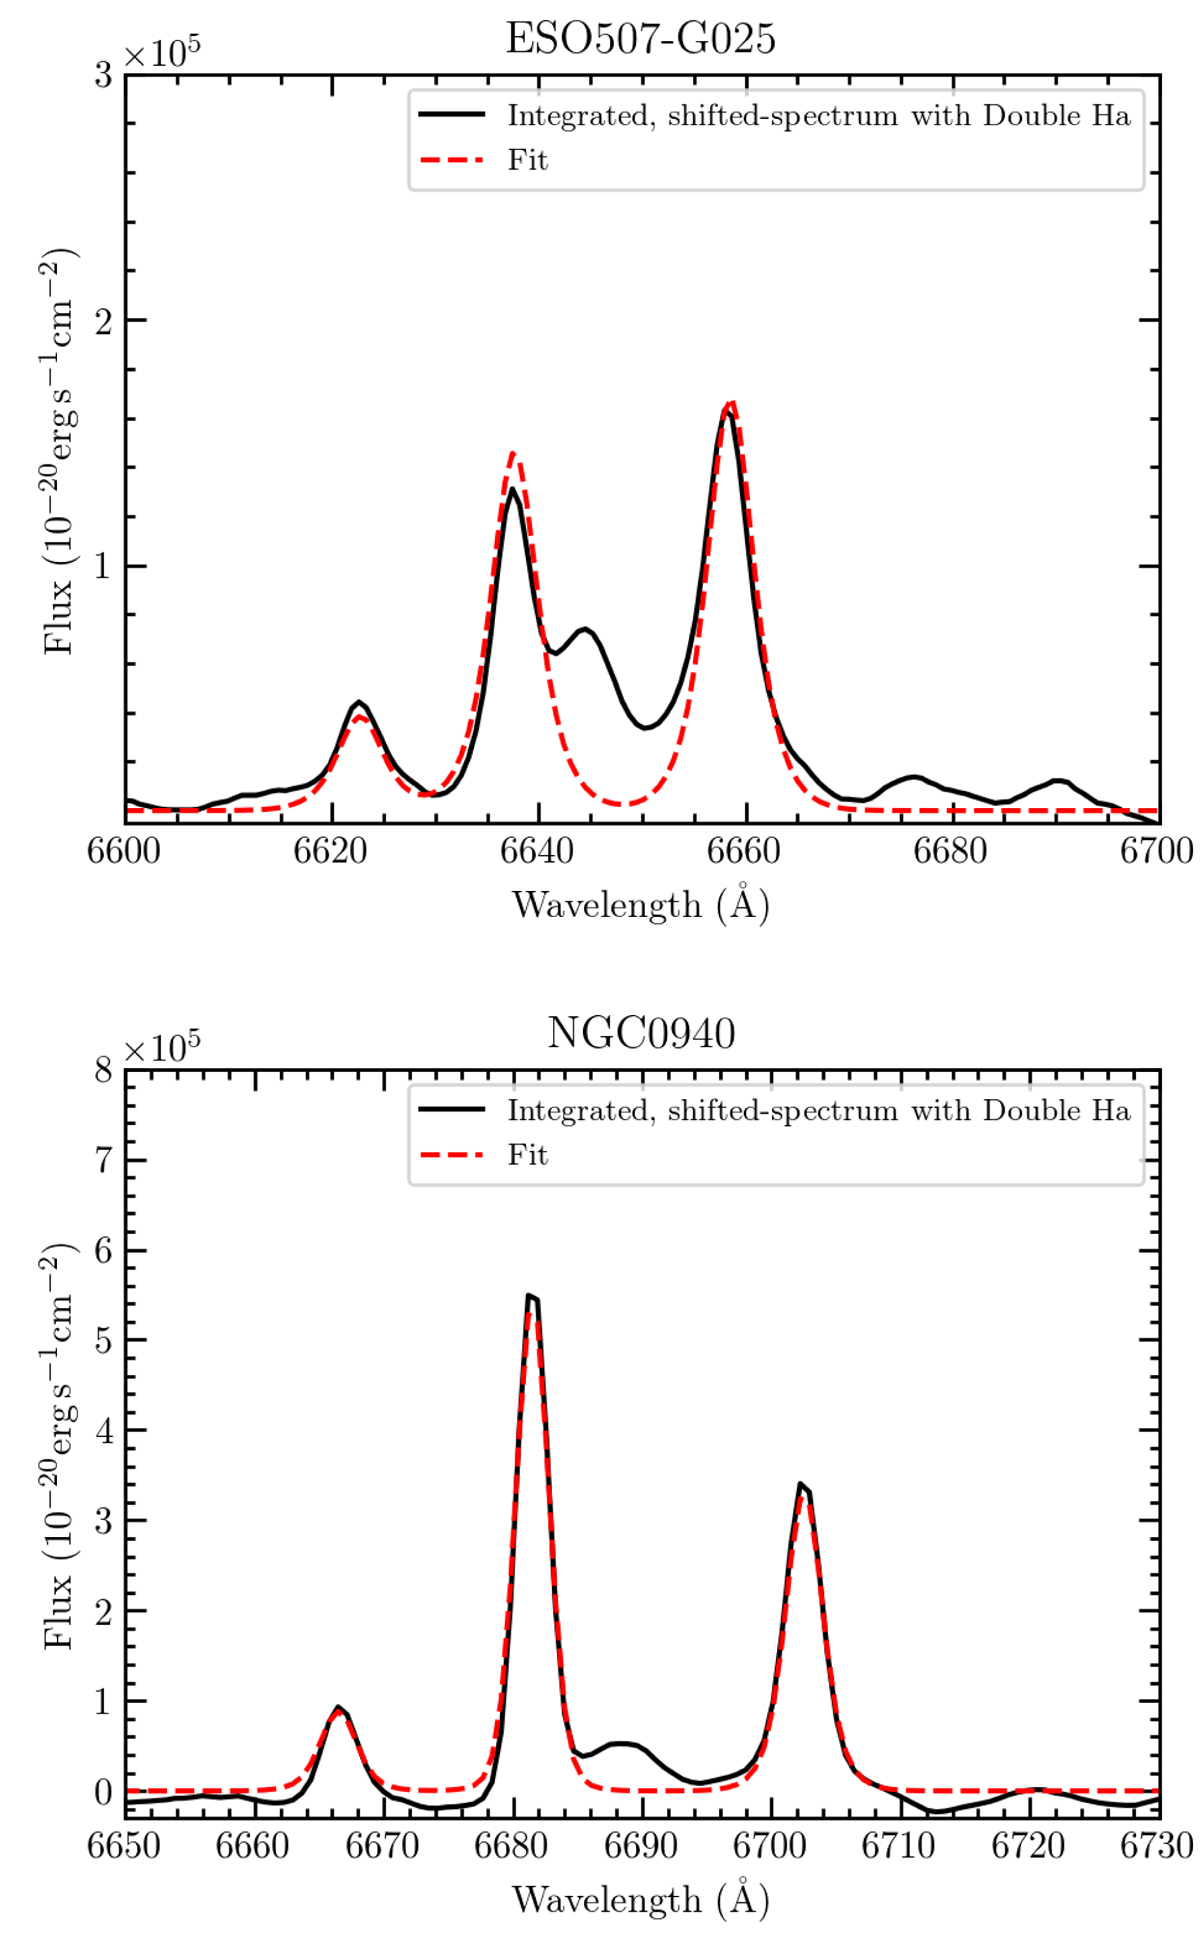
Fig. B.1.
Download original image
Integrated spectrum of the region that has double Hα emission lines. The spectra have been shifted to v = 0 at the respective redshift of each source with the purpose of showing the double Hα emission line.
Current usage metrics show cumulative count of Article Views (full-text article views including HTML views, PDF and ePub downloads, according to the available data) and Abstracts Views on Vision4Press platform.
Data correspond to usage on the plateform after 2015. The current usage metrics is available 48-96 hours after online publication and is updated daily on week days.
Initial download of the metrics may take a while.