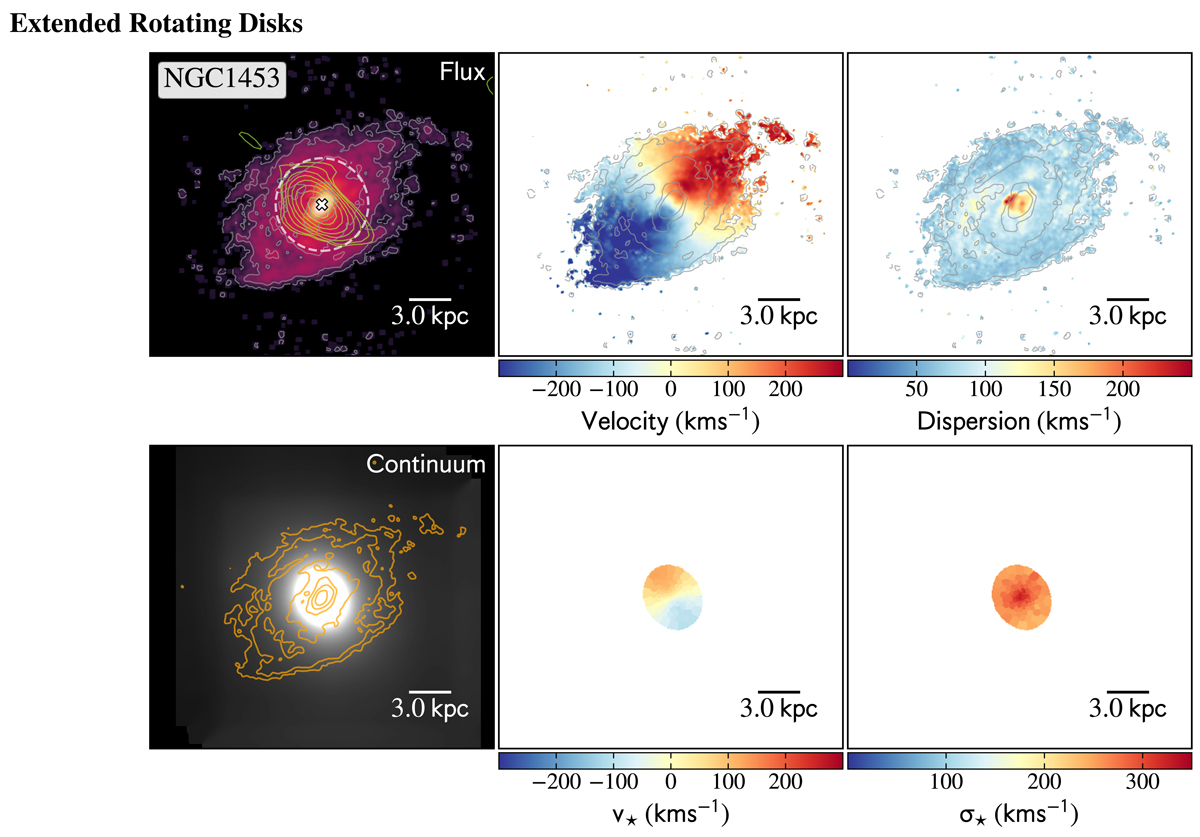
Fig. 2.
Download original image
Maps of the distribution and kinematics of the ionized warm gas and the stellar components for the BGG sample Maps of the spectral fitting to the MUSE data cubes for the sample. First row, from left to right the panels are: (1) the [NII]λ6583 flux map in logarithmic scale, overlaid by GMRT 610 MHz contours in green from Kolokythas et al. (2018), (2) the line of sight velocity profile of the optical emission lines, (3) the velocity dispersion of the emission lines, overlying [NII]λ6583 contours in gray. Second row from left to right the panels are: (1) MUSE continuum image, overlaid by [NII]λ6583 contours in orange, (2) stellar velocity, and (3) stellar velocity dispersion. All sources names are indicated at the top of the first panel of the first row. The 30m beam size from IRAM and APEX observations has been added in white when the sources were nondetected, and in cyan when the molecular gas was detected. North is up and east is left.
Current usage metrics show cumulative count of Article Views (full-text article views including HTML views, PDF and ePub downloads, according to the available data) and Abstracts Views on Vision4Press platform.
Data correspond to usage on the plateform after 2015. The current usage metrics is available 48-96 hours after online publication and is updated daily on week days.
Initial download of the metrics may take a while.