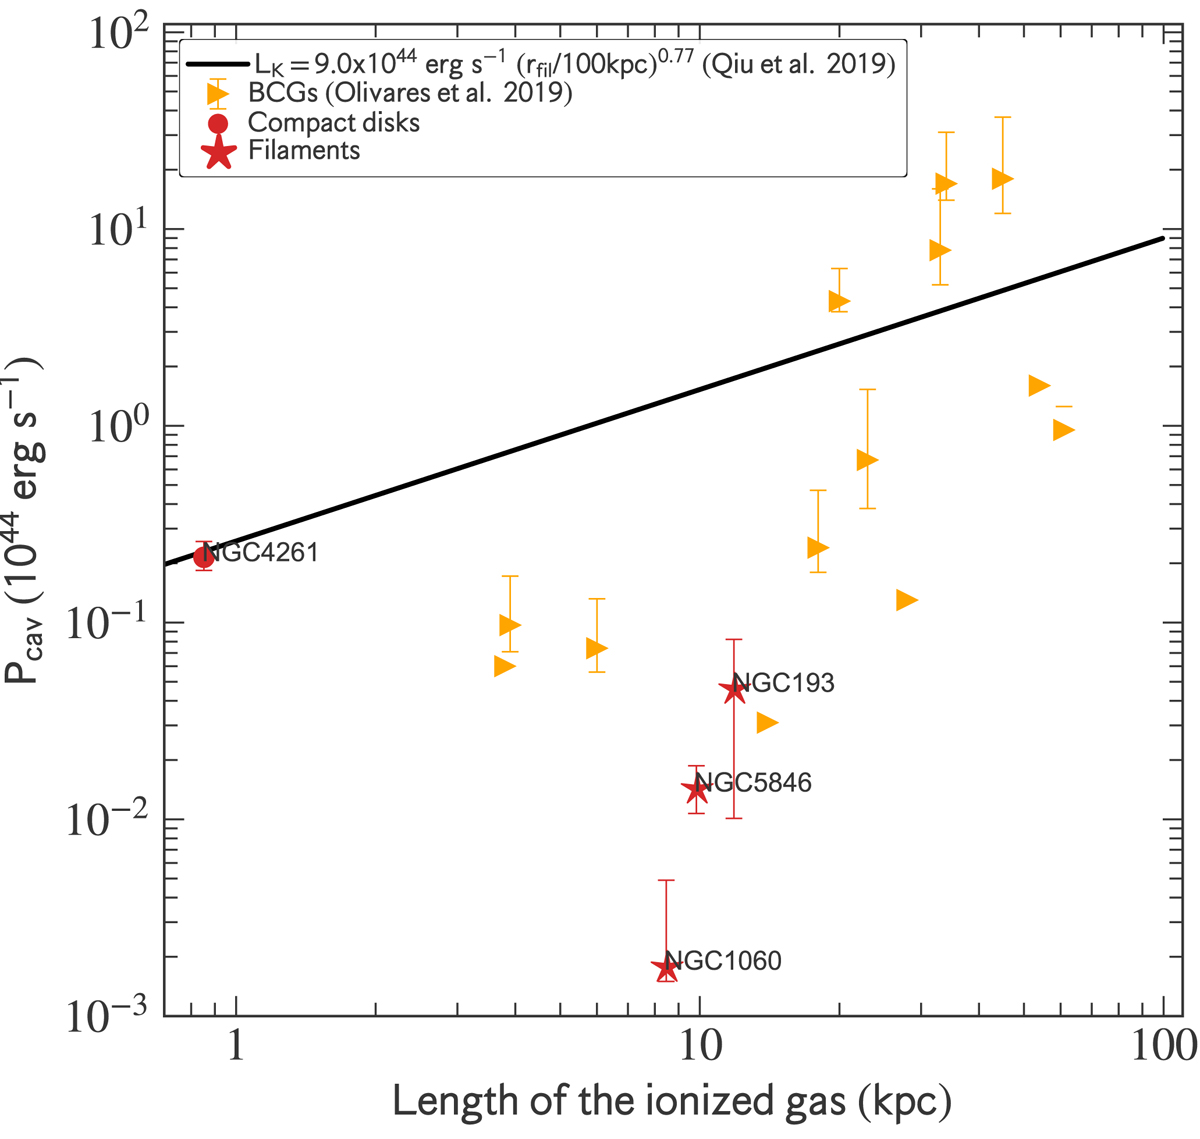
Fig. 15.
Download original image
AGN power versus spatial extent of the ionized gas. The black solid line corresponds to the relation predicted by Qiu et al. (2019) simulations. BGGs with Pcav estimated using their X-ray cavities properties from Kolokythas et al. (2018) are shown with red symbols. Filaments sources and compact disks are displayed with stars and circles, respectively. Yellow triangles mark the BCGs sample from Olivares et al. (2019). Rarely the points follow the correlation, thus ruling out a dominant role of AGN-outflow driven condensation.
Current usage metrics show cumulative count of Article Views (full-text article views including HTML views, PDF and ePub downloads, according to the available data) and Abstracts Views on Vision4Press platform.
Data correspond to usage on the plateform after 2015. The current usage metrics is available 48-96 hours after online publication and is updated daily on week days.
Initial download of the metrics may take a while.