Fig. 14.
Download original image
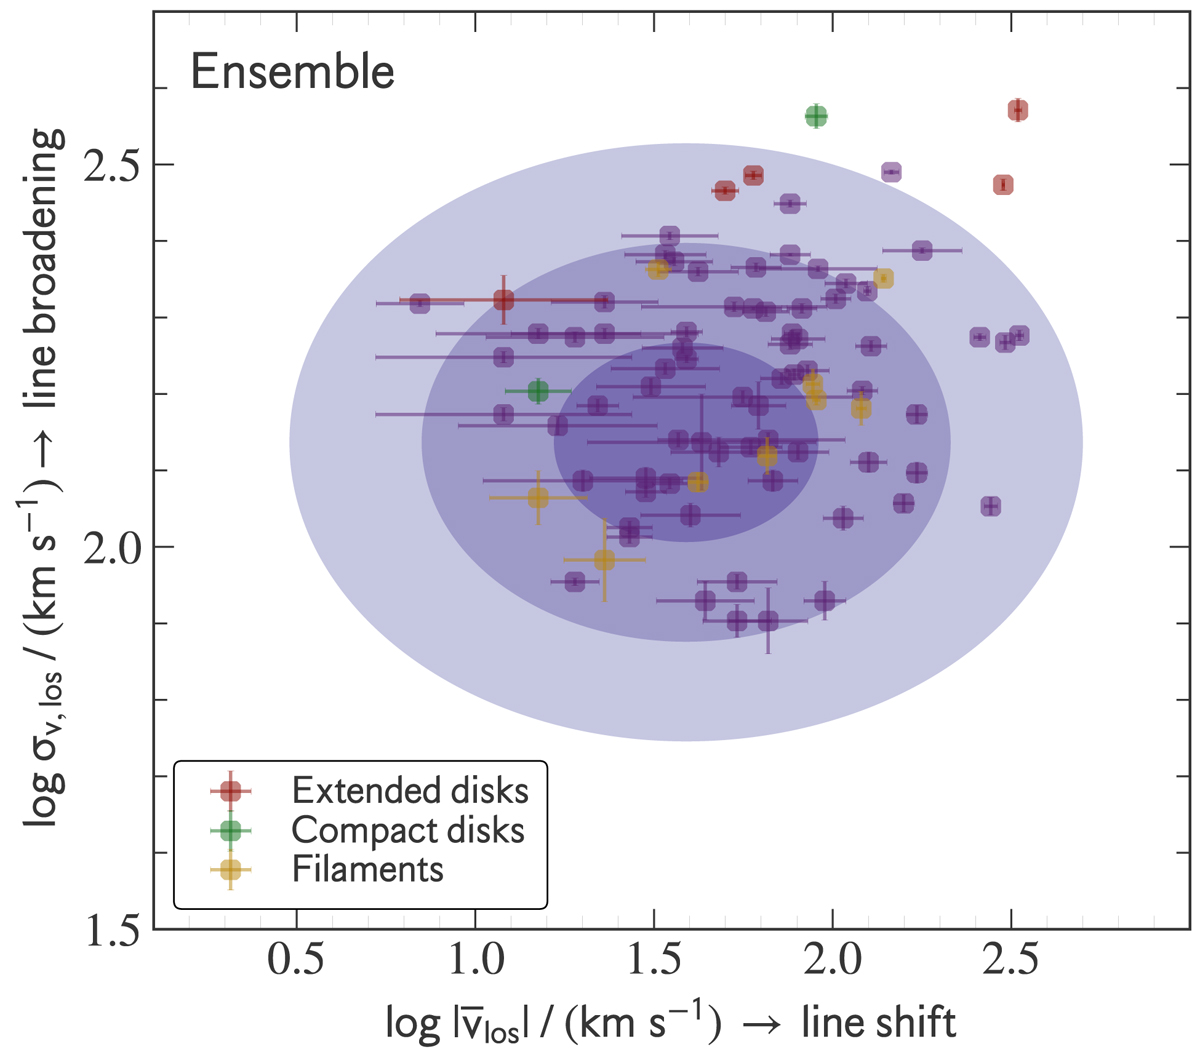
Line shift, |vlos|, versus velocity dispersion, σlos, of the ionized gas. Comparison of observations with the CCA model (Gaspari et al. 2018). The purple shaded region show ensemble (single spectrum) predictions from the CCA simulations at 1σ, 2σ, and 3σ confidence intervals. Data points from our sample are shown with yellow, red, and green circles for filamentary, extended, and compact disks, respectively. Whereas data from the literature are displayed with purple circles (Gaspari et al. 2018). This diagnostic is also known as kinematical plot, in short “k-plot”.
Current usage metrics show cumulative count of Article Views (full-text article views including HTML views, PDF and ePub downloads, according to the available data) and Abstracts Views on Vision4Press platform.
Data correspond to usage on the plateform after 2015. The current usage metrics is available 48-96 hours after online publication and is updated daily on week days.
Initial download of the metrics may take a while.