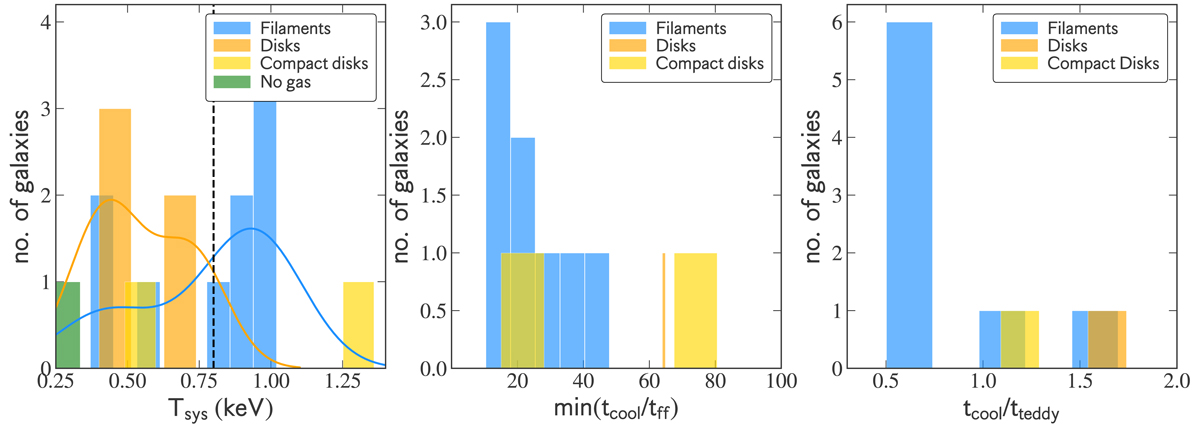
Fig. 12.
Download original image
Distribution of the X-ray properties of our BGG sample. Left panel: histogram of the X-ray temperature. To visualize the distribution of observations, we plot the kernel density estimate (KDE) that expresses the dependence of the disks (orange curves) or filaments (blue curves) on the system temperature, Tsys. Vertical dashed line corresponds to temperature system of 0.8 keV that separate hotter and cooler groups (O’Sullivan et al. 2017). Middle panel: histogram of the min(tcool/tff). Right panel: histogram of the C-ratio, tcool/teddy, at 10 kpc. The bars are color-coded by source classification as disk-like systems with orange bars, compact disk-like systems with yellow bars, filaments with blue bars, and nongas detection with a green bar.
Current usage metrics show cumulative count of Article Views (full-text article views including HTML views, PDF and ePub downloads, according to the available data) and Abstracts Views on Vision4Press platform.
Data correspond to usage on the plateform after 2015. The current usage metrics is available 48-96 hours after online publication and is updated daily on week days.
Initial download of the metrics may take a while.