Open Access
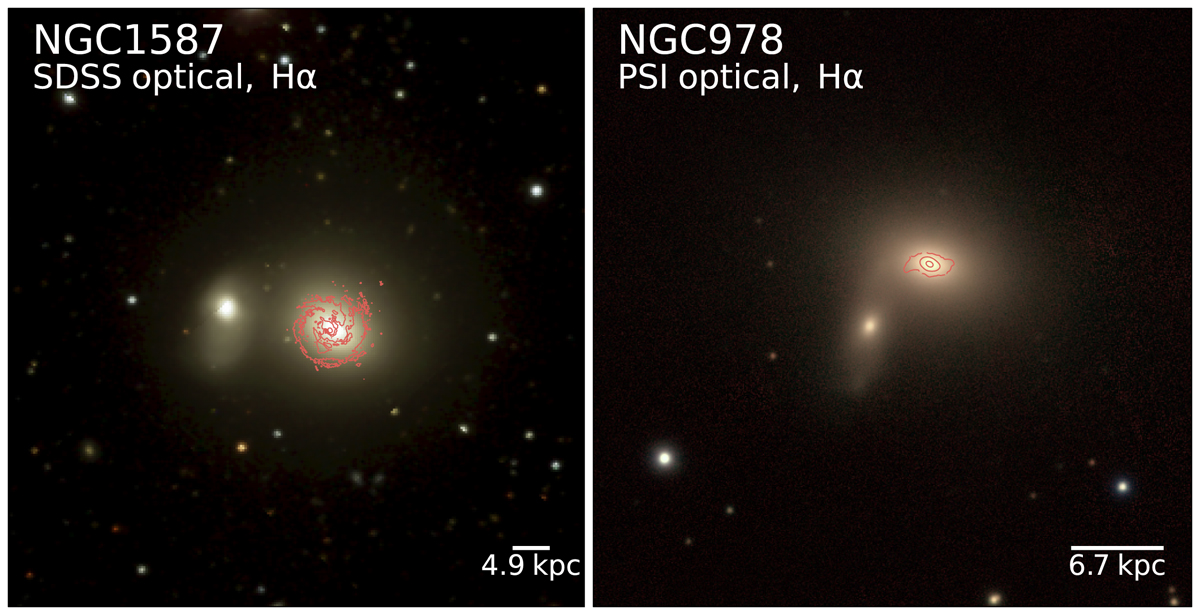
Fig. 10.
Download original image
Optical images of the interacting galaxies of our sample. Left panel: SDSS9 optical image of NGC 1587. Right panel: SDSS9 optical image of NGC 978. The distribution of the optical emission-line gas is shown with red contours.
Current usage metrics show cumulative count of Article Views (full-text article views including HTML views, PDF and ePub downloads, according to the available data) and Abstracts Views on Vision4Press platform.
Data correspond to usage on the plateform after 2015. The current usage metrics is available 48-96 hours after online publication and is updated daily on week days.
Initial download of the metrics may take a while.