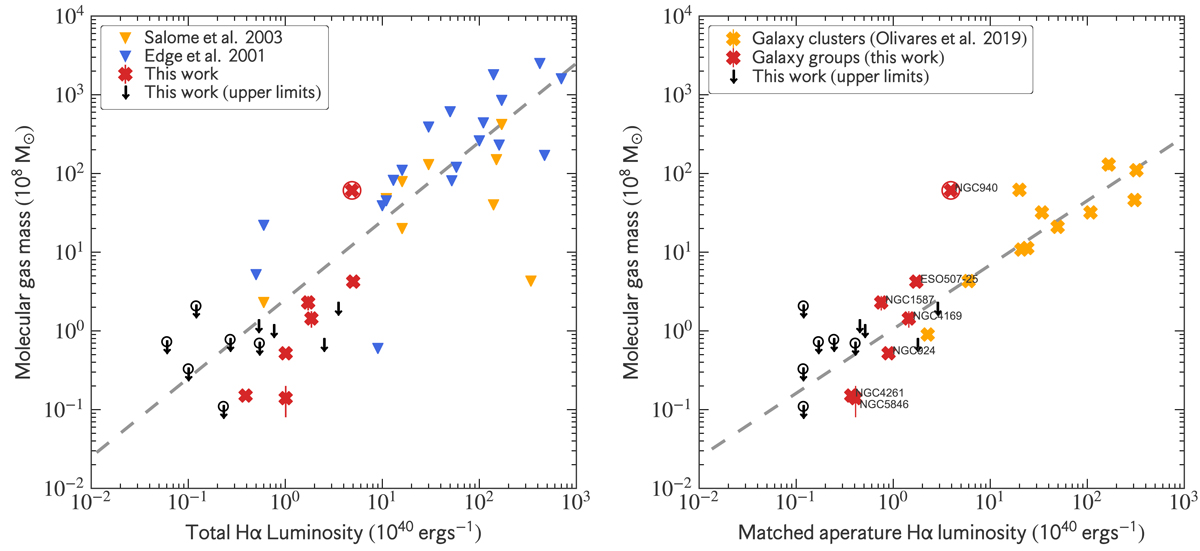
Fig. 8.
Download original image
Comparison of the cold molecular and Hα emitting gas. Left panel: molecular mass versus Hα luminosity. The molecular masses were taken from either IRAM 30m or APEX telescope observations (O’Sullivan et al. 2015; O’Sullivan et al. 2018b). We compare this relation with higher mass systems (BCGs). Observations from Edge (2001) and Salomé & Combes (2003) are plotted with inverted blue and yellow triangles, respectively. Upper limits from previous works are not included in this plot. A clear correlation between Hα luminosity and molecular gas masses is seen, in agreement with the previous detection from BCGs. This correlation is consistent with the top-down multiphase condensation and CCA rain. The gray dashed line corresponds to a linear fit considering only BCGs. Right panel: molecular mass versus Hα luminosity extracted from the same aperture as the CO measurements. The dashed gray line corresponds to the linear fit using measurements from BCGs. The CO molecular gas masses for BCGs are taken from Olivares et al. (2019) using ALMA observations, whereas Hα luminosities are measured using MUSE observations. BGGs showing Hα in absorption at the galaxy center are marked with circles.
Current usage metrics show cumulative count of Article Views (full-text article views including HTML views, PDF and ePub downloads, according to the available data) and Abstracts Views on Vision4Press platform.
Data correspond to usage on the plateform after 2015. The current usage metrics is available 48-96 hours after online publication and is updated daily on week days.
Initial download of the metrics may take a while.