Fig. 9.
Download original image
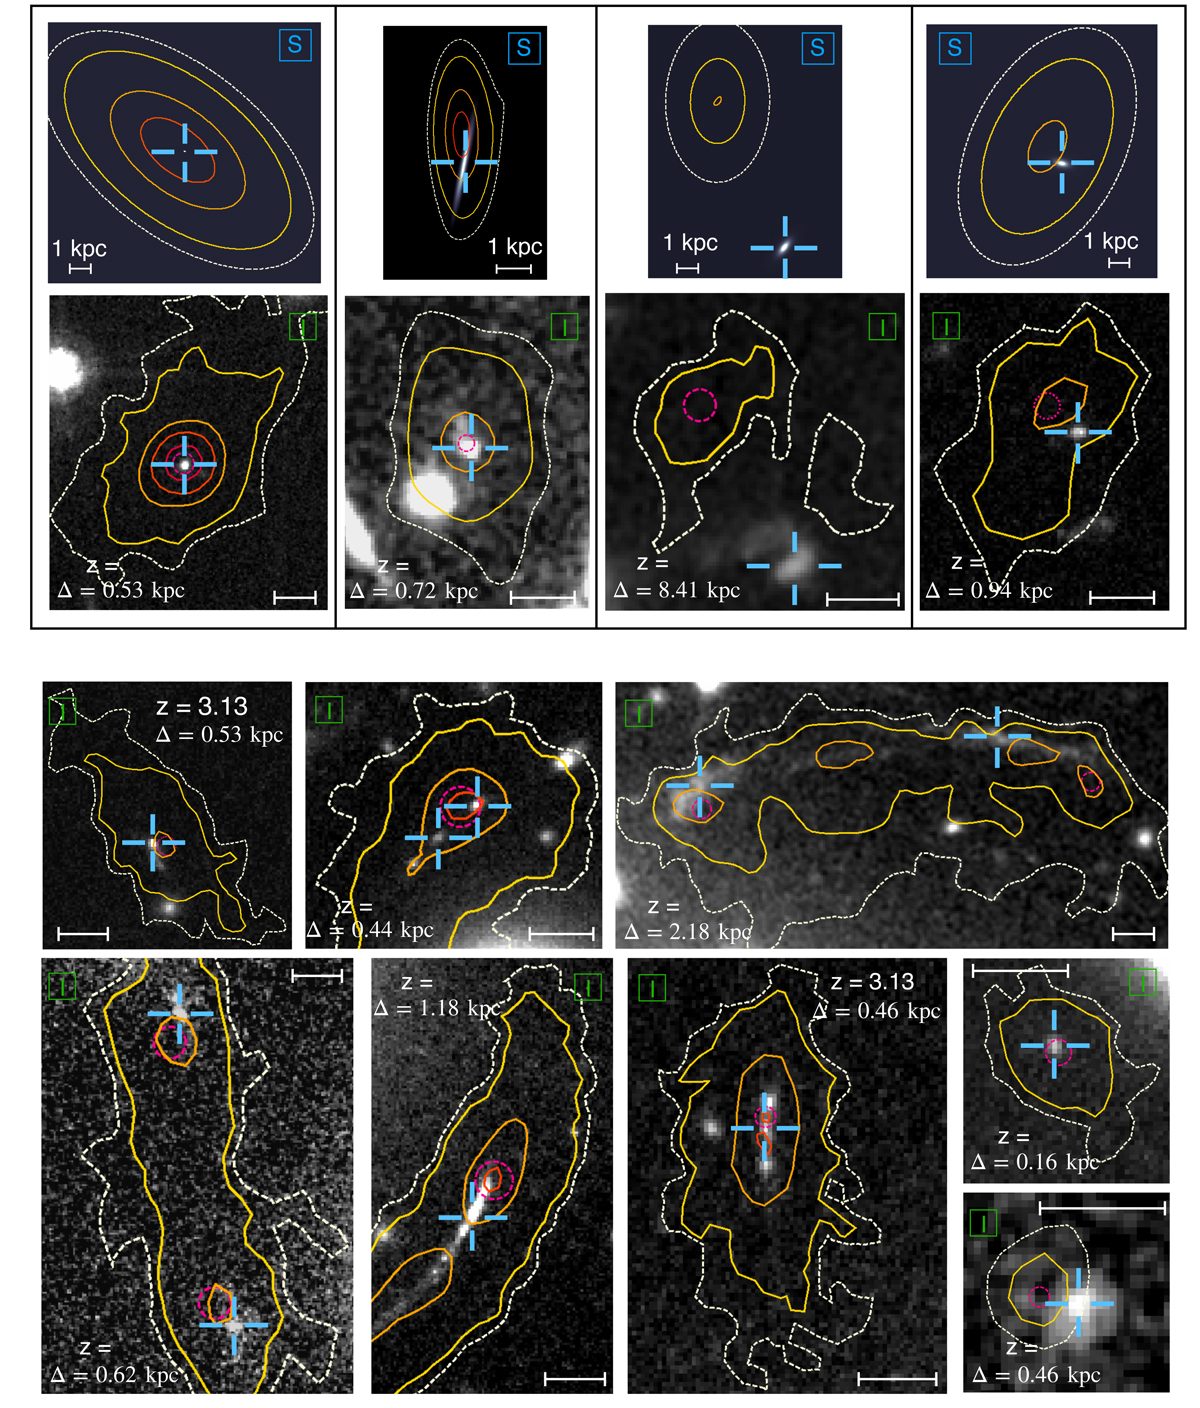
Presentation of 12 objects from the LLAMA sample presenting different values of spatial offsets. For the four galaxies on the top row, we show also the source-plane reconstruction. The observed images are labelled with a green “I” and the source-plane modelisations with a blue “S”. In each panel, we show HST images (F814W or F606W depending of the redshift) or source-plane reconstruction. The MUSE Lyman-α emission is represented by the red, orange, yellow, and white contours which correspond at a smooth surface brightness level of 250, 100, 50, and 12.5 10−19 erg s−1 cm−2 arcsec−2, respectively. The ID, redshift, and magnification values are given for each object. The Δ value is the value of the spatial offset measured in the source plane between the UV and Lyman-α best model centroids. The blue cross indicates the UV position in the image plane and the pink circle the Lyman-α one. In all panels we add a scale (white line) of 1″ in the image-plane and of 1 kpc in the 4 source-planes images.
Current usage metrics show cumulative count of Article Views (full-text article views including HTML views, PDF and ePub downloads, according to the available data) and Abstracts Views on Vision4Press platform.
Data correspond to usage on the plateform after 2015. The current usage metrics is available 48-96 hours after online publication and is updated daily on week days.
Initial download of the metrics may take a while.