Open Access
Fig. 8.
Download original image
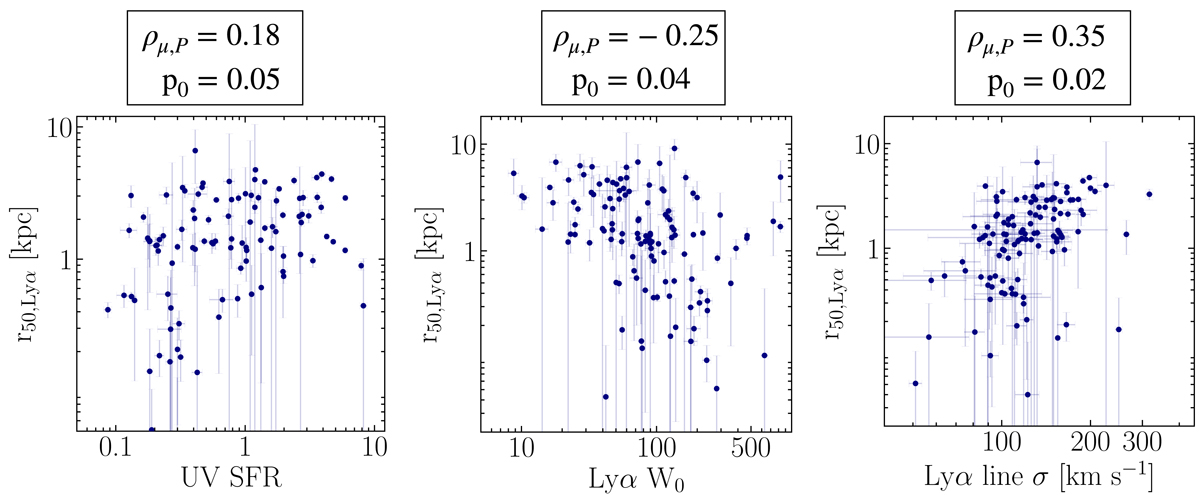
r50, Lyα with respect to (from left to right) the UV SFR, Lyman-α rest-frame equivalent width (W0), and the velocity dispersion of the global Lyman-α line (σ) on the x-axis. We indicate the weighted Pearson coefficient, ρμ, and the associated p-value, p0, at the top of each panel.
Current usage metrics show cumulative count of Article Views (full-text article views including HTML views, PDF and ePub downloads, according to the available data) and Abstracts Views on Vision4Press platform.
Data correspond to usage on the plateform after 2015. The current usage metrics is available 48-96 hours after online publication and is updated daily on week days.
Initial download of the metrics may take a while.