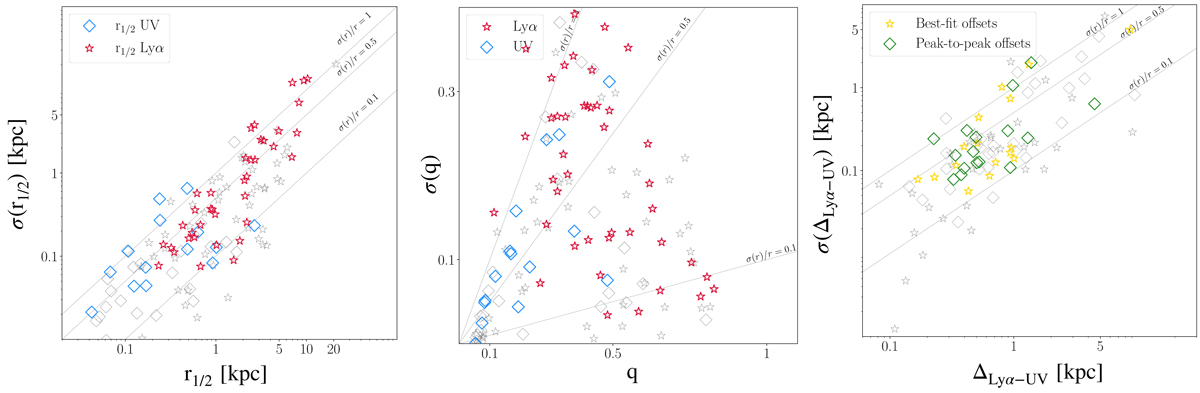
Fig. 7.
Download original image
Dispersion measured in each multiple system of the three main parameters measured: UV and Lyman-α extent, axis ratio, and spatial offset. We measured in each multiple systems the μ-weighted mean values and μ-weighted dispersion of values among the images. From left to right, we represent the dispersion of half-light radius (r50) with respect to μ-weighted mean values, the dispersion of axis ratio (q) with respect to μ-weighted mean values and the dispersion of spatial offset (ΔLyα − UV) with respect to μ-weighted mean values. In each panel, the grey stars and squares represent two-image systems and the colored points show the three (or more) image systems. In the left and middle panels, the stars represents UV r50 and q, respectively, along with the square Lyman-α values. In the right panel, the stars represent best model centroid offsets and green points represents the “peak to peak” offset values (see Sect. 4.3). In all panels, we plot the dashed lines to represent the 10%, 50%, and 100% error levels.
Current usage metrics show cumulative count of Article Views (full-text article views including HTML views, PDF and ePub downloads, according to the available data) and Abstracts Views on Vision4Press platform.
Data correspond to usage on the plateform after 2015. The current usage metrics is available 48-96 hours after online publication and is updated daily on week days.
Initial download of the metrics may take a while.