Open Access
Fig. 6.
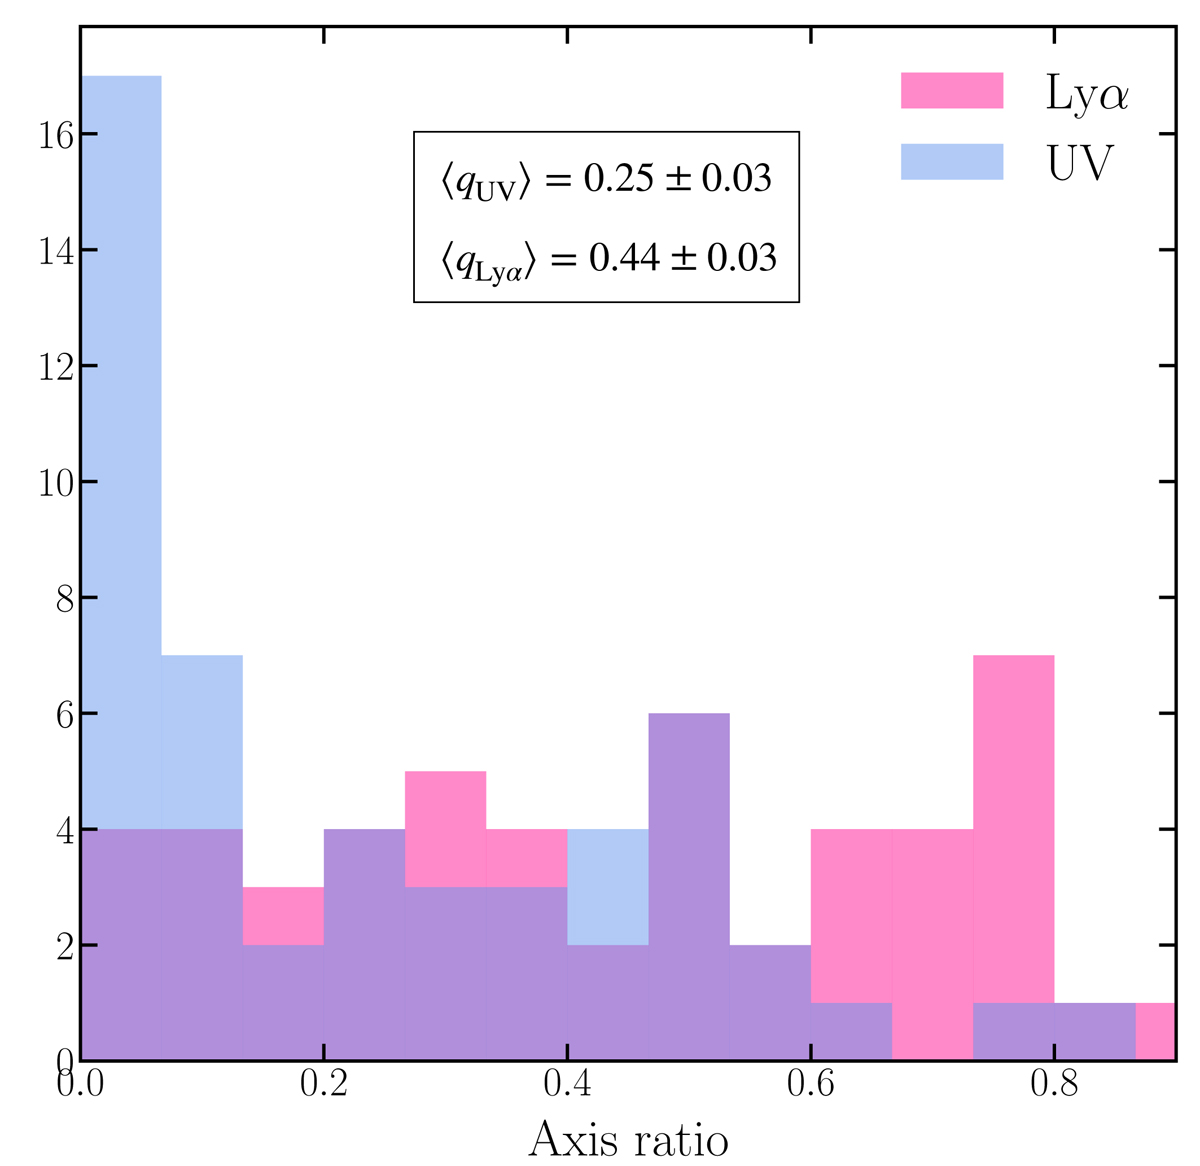
Download original image
Distribution of axis-ratio (q = b/a) of UV (blue) and Lyman-α (pink) emission in the source plane. For multiple systems, we measured the magnification weighted mean of the axis ratio values of only the multiple images located inside the green contour of Fig. 3. The mean values of the two subsets are indicated on the plot.
Current usage metrics show cumulative count of Article Views (full-text article views including HTML views, PDF and ePub downloads, according to the available data) and Abstracts Views on Vision4Press platform.
Data correspond to usage on the plateform after 2015. The current usage metrics is available 48-96 hours after online publication and is updated daily on week days.
Initial download of the metrics may take a while.