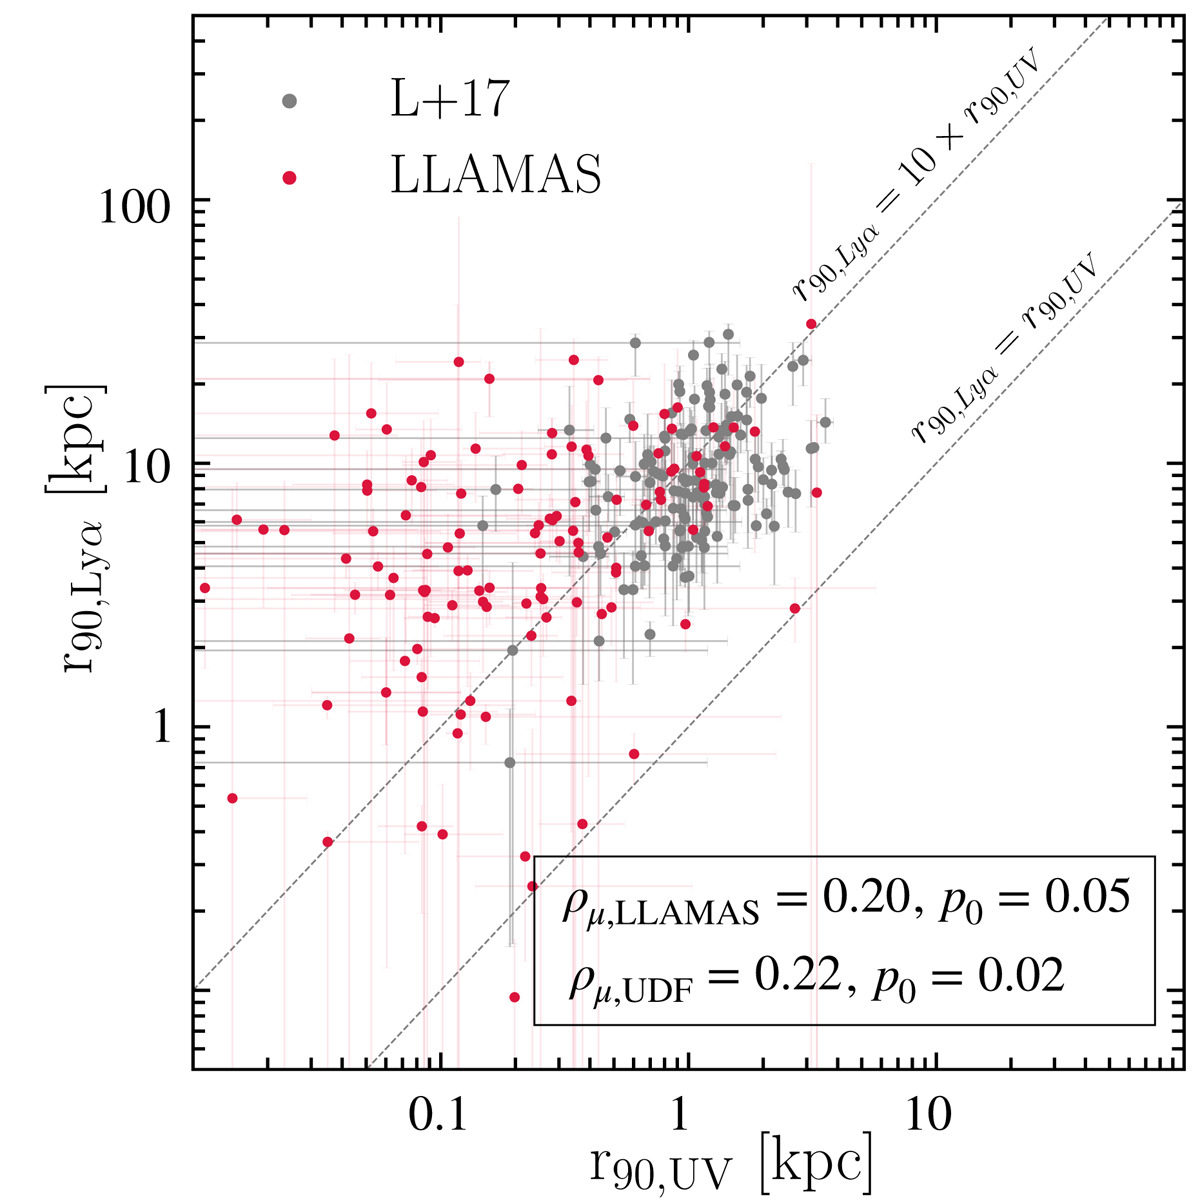
Fig. 5.
Download original image
Comparison of Lyman-α and UV circularized 90%-light radii. The figure shows the Lyman-α 90%-light radius. LLAMAS and UDF (Leclercq et al. 2017) galaxies are represented in red and grey, respectively. The UDF and LLAMAS values are both correlated (Spearman weighted p-value of p0 = 0.02 and p0 = 0.05 for UDF and LLAMAS, respectively). Both datasets are roughly centered around rLyα = 10 rUV.
Current usage metrics show cumulative count of Article Views (full-text article views including HTML views, PDF and ePub downloads, according to the available data) and Abstracts Views on Vision4Press platform.
Data correspond to usage on the plateform after 2015. The current usage metrics is available 48-96 hours after online publication and is updated daily on week days.
Initial download of the metrics may take a while.