Fig. 4.
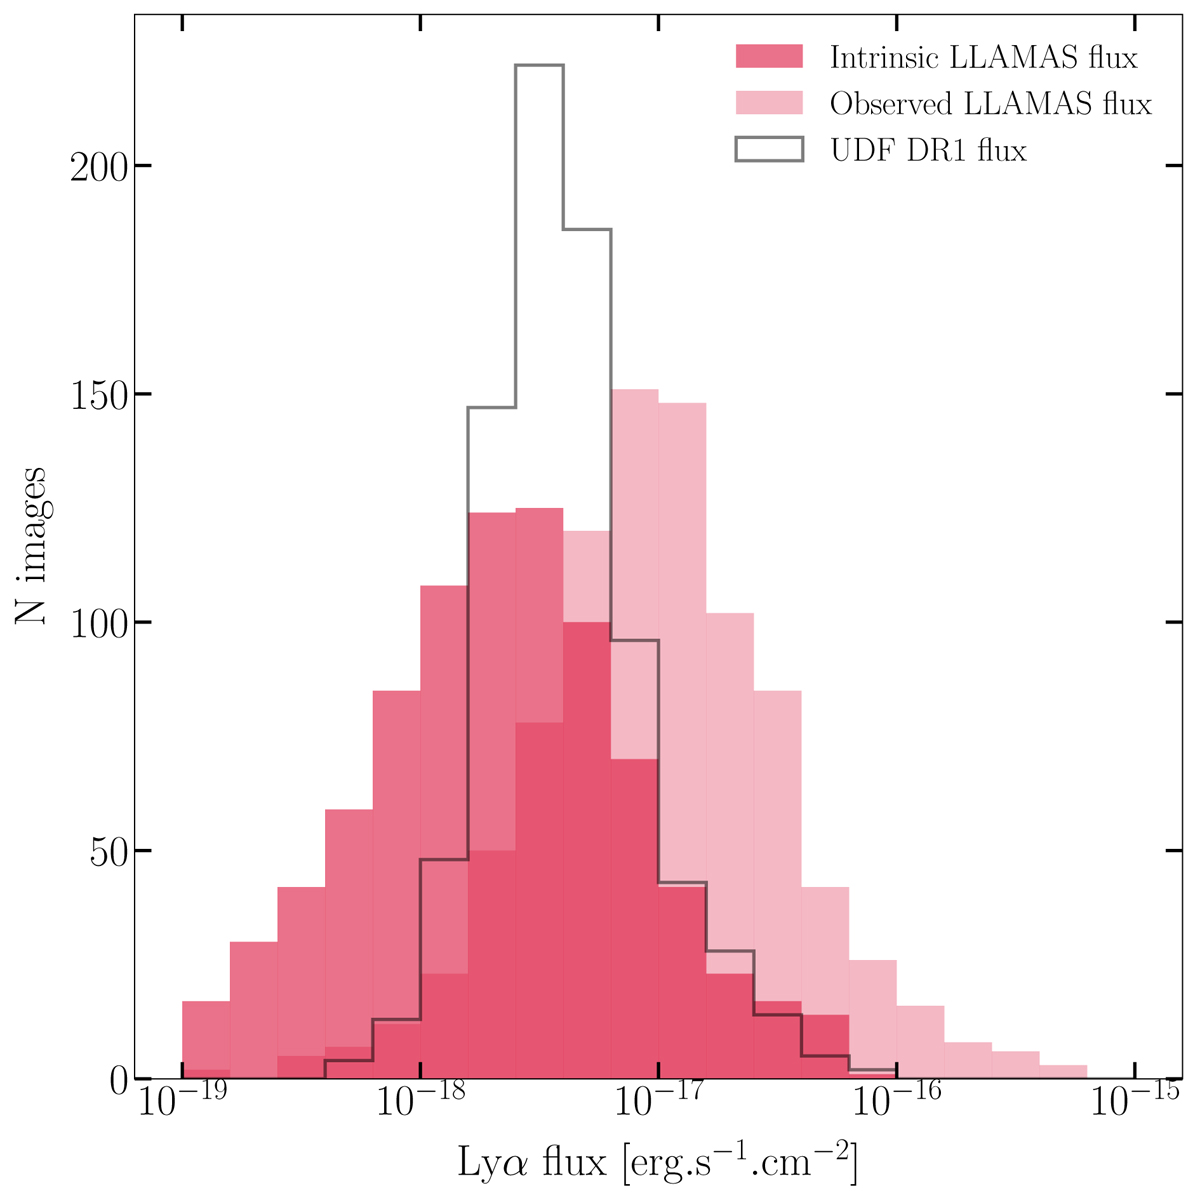
Download original image
Lyman-α line flux distribution of the LLAMA galaxies and UDF Lyman-α halos presented in Leclercq et al. (2017). The light pink histogram shows the distribution of the observed flux of Lyman-α images in the LLAMA sample. The dark pink histogram represents the intrinsic flux distribution of the LLAMA galaxies, obtained by dividing the observed flux by the lensing magnification. This histogram shows only the images selected for spatial fitting (see Fig. 3). The typical uncertainty at 1σ for LLAMAS flux measurement is about 1.2 × 10⁻¹⁸ erg s−1 cm−2. The grey histogram shows the observed Lyman-α flux of the Lyman-α halos presented in Leclercq et al. (2017).
Current usage metrics show cumulative count of Article Views (full-text article views including HTML views, PDF and ePub downloads, according to the available data) and Abstracts Views on Vision4Press platform.
Data correspond to usage on the plateform after 2015. The current usage metrics is available 48-96 hours after online publication and is updated daily on week days.
Initial download of the metrics may take a while.