Fig. 3.
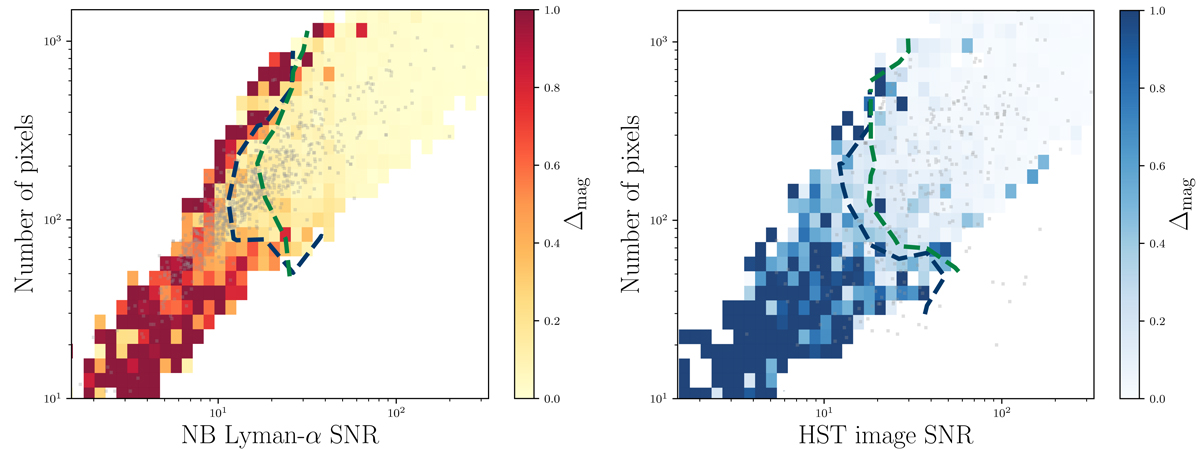
Download original image
Distribution of residual magnitudes between simulated source and best-fit parameters for MUSE Lyman-α NB images in the left panel and HST images in the right panel (see Sect. 3.4). The grey points represent the LLAMAS galaxies. All the objects in the blue dashed contour were selected for spatial fitting with LENSTOOL based on the magnitude difference between input and best-fit parameters (Δmag < 0.3). The green dashed contour represents where the spatial fit will recover both the flux distribution and morphological information on the sources as estimated by the fraction of non-overlap between the simulated and fitted sources (see Sect. 3.4).
Current usage metrics show cumulative count of Article Views (full-text article views including HTML views, PDF and ePub downloads, according to the available data) and Abstracts Views on Vision4Press platform.
Data correspond to usage on the plateform after 2015. The current usage metrics is available 48-96 hours after online publication and is updated daily on week days.
Initial download of the metrics may take a while.